Twins Video
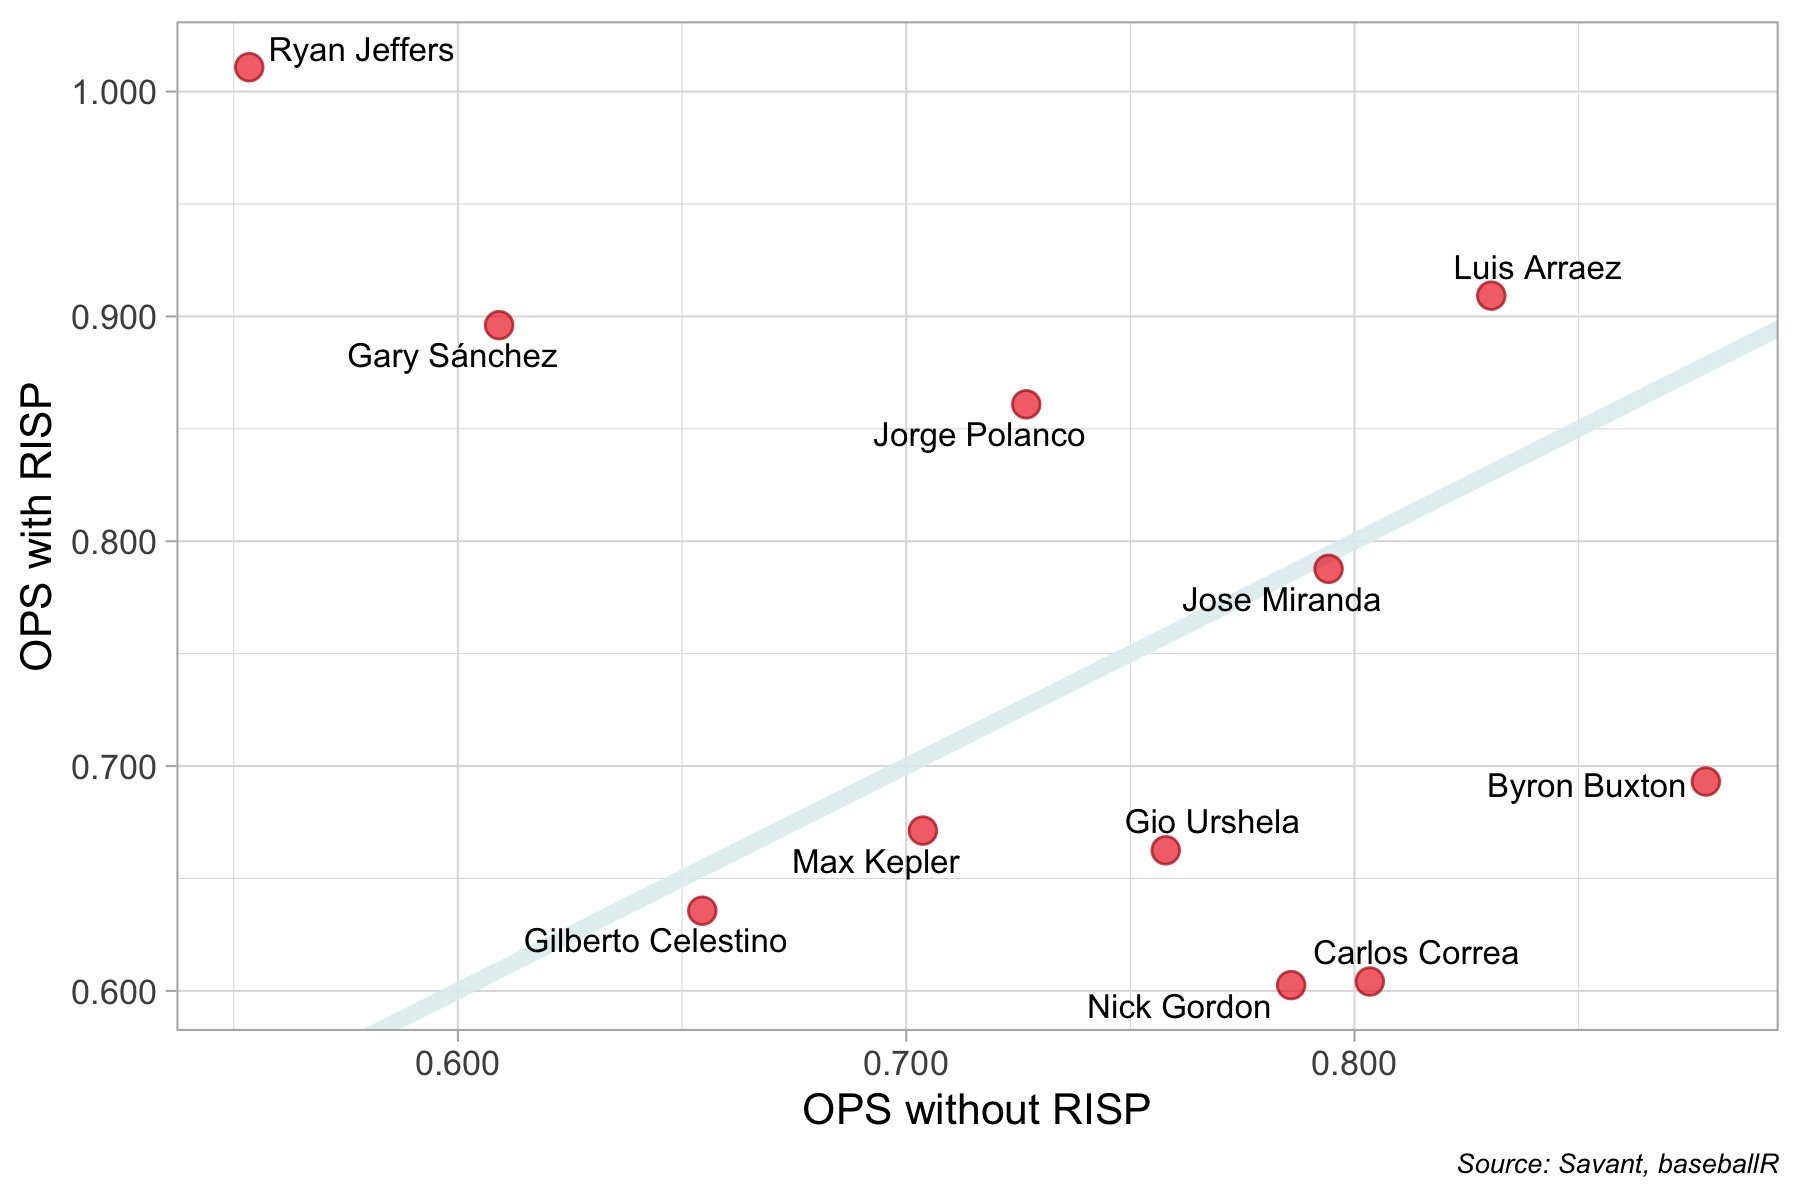
The above graph plots hitting performance with OPS (on-base + slugging percentage) without runners in scoring position on the x axis and with runners in scoring position on the y axis. A point on the gray diagonal line has equal performance with and without RISP. The further a point is vertically above the line, the better the hitter performs with RISP relative to their performance without. Those hitters are performing in important spots. The farther below the line, the more the hitter is coming up empty in big moments relative to their performance otherwise.
A few things stand out:
- The Twins have 4 players who have hit significantly better with RISP and 4 who have hit significantly worse. As a team though, they hold a 0.723 OPS with RISP (#20 in MLB) and a 0.632 OPS with RISP and 2 outs (#28 in MLB).
- Ryan Jeffers has the team's most extreme splits. He owns a 0.553 OPS without RISP compared to a team-high 1.011 OPS with. Gary Sánchez has large splits as well.
- Carlos Correa deserves special mention. Without RISP, he's third among qualifying Twins with an 0.803 OPS. With RISP, only Nick Gordon has performed worse.
- Jorge Polanco has the most plate appearances with RISP on the Twins. Thankfully, he has come through with an 0.861 OPS in those crucial spots.
Note that this analysis is best viewed as descriptive of past performance rather than predictive of future performance. A future tidbit will compare numbers with and without RISP in previous seasons to see if these splits carry over at all from year to year.
View our top trade candidates list, up to nearly 70 names and updated regularly!
View Trade CandidatesFollow Twins Daily For Minnesota Twins News & Analysis


- wavedog, mikelink45, verninski and 2 others
-
 5
5


Recommended Comments
Create an account or sign in to comment
You need to be a member in order to leave a comment
Create an account
Sign up for a new account in our community. It's easy!
Register a new accountSign in
Already have an account? Sign in here.
Sign In Now