

Eric Blonigen
-
Posts
377 -
Joined
-
Last visited
-
Days Won
1
Reputation Activity
-

 Eric Blonigen reacted to Paul D for a blog entry, Baseball Card Collecting Before It Was A Business
Card Collecting in the Early 1900’s
Card collecting in the early 1900’s was before my time and my dad’s, but not my grandfather’s. He arrived in Ellis Island in 1907 but did not acquire a taste for baseball or card collecting in his lifetime. If he had it would have been great because the T206 cards (1909-1911) common cards are worth at least $50 each in the 520 card set.
Unlike later baseball cards the T206 cards came in packs of cigarettes, issued by the American Tobacco Company. And because of that, the most sought after card ever is the Honus Wagner card that was card number 500 in the set. For those unfamiliar, the card was part of the original issue but Wagner refused to allow production of his card. Most publications list his objections to the cards because it encouraged people, especially youngsters, to buy cigarettes to obtain cards. I have also seen where he objected because he had not received adequate compensation to appear on the cards. The American Tobacco Company halted production of the card when it received notification of Wagner’s objections, but there had already been a few of his cards printed and inserted into packs. The number of Wagner cards that escaped is impossible to verify, but the estimates range from 50 to 200.
In August of 2021 a Wagner was sold at auction for $6.6 million and was rated a SGC 3 (an independent appraiser rating where a perfect card is a SGC 10). In August 2022 a SGC 2 (lesser condition) sold for $7.25 million.
Being a long time collector myself, I bought a T206 a number of years ago, it was a Frank “Home Run” Baker card. Not sure how much I paid for it, but currently it is valued by Beckett from $250 to $400 depending on condition. I certainly didn’t pay that much at purchase time, but I would guess a card that is over 115 years old of a Hall of Famer should have decent value.
In addition to the T206 set, there was also a T205 set from 1911, also by the American Tobacco Company, a 1914 and 1915 issue by Cracker Jack and 1916 by The Sporting News.
Card Collecting in the 1930’s
Card collecting in the 1930’s was before my time, but not my dads. The main focus on cards in the 1930’s was the Goudey set. The cards were the first to contain gum and many of the cards had a Big League Gum banner on the front of the card. The card was square in shape and smaller than today’s cards. Rather than a photo of the player, it seemed like more of a painting. The 1933 Goudey set was the first issue since the 1916 Sporting News set.
Fortunately for me, my dad loved baseball and collected baseball cards, and unlike most kids, he or my grandmother never threw his cards away.
The highlight of the set were multiple versions of some of the greats. There were 4 different Babe Ruth card. One of the cards had a double run (had twice as many printed as the normal card), but still is a very valuable card. Two of the other three cards, however, are worth more. There were also multiple cards of players like Lou Gehrig, Jimmy Foxx, Mel Ott, Goose Goslin, Rogers Hornsby, Lefty O’Doul, Bill Terry, Carl Hubbell and 3 of Joe Cronin.
There was one card issued in 1934. It was card number 106. There was no #106 in the original set and to handle complaints from collectors they issued a card of a retired superstar, Napolean “Nap” Lajoie and sent this card numbered 106 to those that complained and offered the card through a mail in offer. Even though the Lajoie is more scarce, one of the Ruth’s is of equal value. Beckett places a value of $25,000 to $60,000 for both the Lajoie and the #53 Ruth, $20,000 to $50,000 for the Ruth #181, and $15,000 to $40,000 for Ruth #144 and #149. A Jimmy Foxx (2) is valued at $1,000 to $2,500 and Lou Gehrig # 160 at $800 to $2,000 and #92 from $6,000 to $15,000.
There is one card of high value for a player who had an average career. That player was Morris (Moe) Berg. Moe Berg would be a spy for the US during World War II and received the Presidential Medal of Freedom for his contributions during the war. Moe’s card #158 is valued from $400 to $1,000.
In all, there were 240 cards in the set and it was full of Hall of Famers. Included were: Dazzy Vance, Ted Lyons, Bill Dickey, Pie Traynor, Kiki Cuyler, Paul Waner, Jimmy Foxx (2), Tony Lazzeri, Al Simmons, Heinie Manush (4), Frankie Frisch, Babe Ruth (4), Red Ruffing, Waite Hoyt, Joe Cronin (3), Burleigh Grimes, Eppa Rixey, Mickey Cochrane, Red Faber, Tris Speaker, Lou Gehrig (2), Travis Jackson, Earle Combs, Nap Lajoie, Goose Goslin (2), Rabbitt Maranville, Rogers Hornsby (2), Bill Terry, Mel Ott (2), Chuck Klein, Sam Rice, Herb Pennock, Leo Durocher, Joe Sewell, Lloyd Waner, Earl Averill, Rick Ferrell, Gabby Hartnett, Hack Wilson, Lefty Grove, Charlie Gehringer, Dizzy Dean, Billy Herman, and Carl Hubbell (2). That’s 58 Hall of Famer cards in the set, almost 25% of the cards. And to add value to this series, it would be their rookie card also.
There would be other card sets from the 1930’s such as 1934 Goudey, 1935 Goudey (4 in 1), 1936 Goudey, 1933 Tattoo Orbit, 1934-36 Diamond Stars, 1935 Schutter-Johnson Candy, 1936 National Chicle and 1939 Play Ball, but none that would have the value of the 1933 Goudey set.
Card Collecting in the 1950’s
Growing up in the 50’s and 60’s was so different than growing up in later years, especially when it came to baseball card collecting.
If I could find a Delorian and go back in time, my first trip would be back to 1952 so I could spend my money hoping to open a pack or two or three to get the Mantle rookie. Next I would wait a couple of year and take all of my 1955 and 1956 Topps cards and store them in a hard case rather than “pitching” them at school with my friends or putting them into the spokes of the front wheel of my bike to get that awesome sound.
The 1955 and 1956 Topps were iconic sets. Both were set in landscape (horizontal) view rather than the more common portrait view. The 1955 set had some awesome rookie cards, namely Roberto Clemente, Sandy Koufax, and future Twin, Harmon Killebrew. Clemente is valued from $3,000 to $8,000, Koufax $2,000 to $5,000 and Killebrew $300 to $800. Non-rookies Mays and Robinson are $1,000 to $2,500, Aaron $750 to $2,000 and Williams is $500 to $1,200.
The 1956 set had no major rookie. However the 1956 had more cards in the set (340 vs. 206) and some major stars, especially Mickey Mantle, who was not in the 1956 set ($2,000-$5,000), Jackie Robinson ($600-$1,500)(his last card), Ted Williams ($300-$500), and Roberto Clemente ($750-$2,000).
But cards were not investments back then, they were sports toys. It was my first exposure to gambling where it was me against him in trying to win as many of his baseball cards as possible by pitching them.
It was called pitching and there was little regard for which card you chose to pitch at that moment. You would pitch your doubles because the collecting part of the hobby was getting the entire set of cards, not the stars or rookies. Maybe you would put your favorite player or team’s cards at the bottom of the stack, but for the most part you played with little regard for the players you may lose to your opponent.
Being from Rhode Island, I was a huge Red Sox fan, and naturally that would almost certainly mean that I was a Yankee-hater. Possibly the Yankee players were the first to be “pitched” since I had no issues with losing any of them in the competition. God knows how many Mantle, Ford and Berra’s I may have had in my stack and ended up losing.
But really what it boiled down to was that no card was handled with kid gloves, and every card was eligible to be altered by “pitching” them in a contest. To have a card with ideal corners was close to impossible since a corner was the most vulnerable part of a card when being tossed. Then the gloss on the top was next to take the brunt of damage because we played many games in the school yard and the cards would be sliding along on cement or asphalt.
The cards were also subject to the dreaded elastic band. There were no see-through cases back then. Cards were kept in shoe boxes, but kept together with elastic bands. And organizing cards was done by sorting in numerical order so you could quickly see whether you already had a player when opening up a pack of cards. Number 1 was always on the top and that is why when you go to a price guide and look up cards in the 1950’s, card number 1 was always worth more than many other cards even if that card was not a superstar. The top and bottom card would always have indentations that detracted from their value.
The first set I remember collection was the 1954 Topps set. I was 5 years old at the time, so it would have been my dad who bought the cards for me. Number 1 in 1954 was Ted Williams, a superstar. His card is only outvalued by the Hank Aaron and Ernie Banks rookie cards. Ted would have been in that select company even if he were not card #1. In 1955 the Topps set had Dusty Rhodes as #1. Hardly a superstar, and surely a common if he had any other number. His card is 5 times the value of any other common card because of its card number. Two other examples would be the 1956 Topps with American League President Will Harridge as #1. That was the last card you wanted to see in your pack. A league president?, seriously! Card #2 was Warren Giles, the National League President. Currently the Harridge card is 20 times the value of a common, while Giles is 4 times the value. Practically the same card, the number 1 card was valued 5 times higher because it would be exposed to abuse by being in the front of the number sorted stack.
Finding places that sold baseball cards was never a problem. On my way to school (there was no such this as a school bus for us) we would walk past 2 variety stores that sold penny candy and baseball cards. My easiest way of buying cards, especially with no school during the summer, was a traveling store that came through my neighborhood every weekday. This was the size of a self-contained RV and had shelves built into the vehicle that contained canned goods and other grocery items. God knows what would have happened if there were “sell by” dates back then. He was my main source of cards and would usually have cards on the truck except when he would sell out that day. Cards were usually 5 cents for a pack of 6 cards, but some places would sell a pack for 1 cent, but it only contained 1 card. There would be a rectangle piece of gum in each pack and the gum would normally stain the back of the last card in the pack. But the gum was great for sticking multiple pieces in your mouth and looking like you were chewing tobacco.
When it came to pitching cards, there were 3 different games you could choose from. If you played at someone’s house, that kid would pick the game. You could change games, so if you were not having luck with one of the options, you could pick another to try and change the outcome.
The most common games were “farzees”, “topzees” and “standeez”. Farzees would be one card pitched by every player (you could have an unlimited number of players competing against each other). You would toss against a wall (indoors or outdoors), and the person whose card came to rest closest to the wall would win all the cards. Topzees had an unlimited number of rounds and space. The winner would be the person who was able to get his (I use his because my experience with pitching cards never included a girl who participated) card on top of one of the cards already tossed. The winner just needed a very small overlap on the cards to win. The player who “topped” would win all the cards and if you were not confined to an area, you could win quite a stash. Standeez was the other contest and this was the game that caused the most abuse to the card. The first “pitcher” would place a card against a wall standing up at an angle of about 30 degrees. The game was won when you “pitched” a card that knocked the standing card from upright to flat on the ground (floor). The winner would collect all the cards already tossed. Because you were throwing against a wall and you would toss with greater speed than the other games, no card was unscathed from corner damage.
So, when you look at baseball cards from the 1950’s and see the value for premium condition, you’ll know that the likelihood of having a card in great condition was extremely unlikely. It was truly a game and not an investment.
I am eternally grateful that while I was away in the Army my mom never got the boxes of my cards and got rid of them just as my grandmother never did with my dad’s.
Many days and nights were spent reading and digesting the back of a card. Statistics were always part of the card, but other features would vary from year to year.
I can’t imagine growing up without the thrill of opening up a pack of cards or pitching them in a game with friends or classmates.
-

 Eric Blonigen got a reaction from Longdistancetwins for a blog entry, A weekend in Cooperstown - Joe Mauer’s HOF induction
Over the past few days, there have been some great articles written about Mauer’s accomplishments - the batting titles, the MVP season, the records, and the magic he brought to life on a near-daily basis for 15 years.
Today, he was deservingly enshrined in the Baseball Hall of Fame alongside Todd Helton, Adrian Beltré, and Manager Jim Leyland in Cooperstown, New York. I was fortunate enough to be present for it.
Being there was an amazing experience. That is likely true for a number of other members of Twins Territory as well. Anecdotally, close to half of the fans in attendance wearing jerseys, team shirts, or other memorabilia were repping Mauer.
The whole weekend was a celebration of baseball legends, with a parade on Saturday, the induction today, and a speaker’s series taking place tomorrow with a Q&A panel with this year’s inductees.
Walking through the picturesque small-town downtown area, there were over a dozen cash-only vendors selling hot dogs and burgers they were grilling along the sidewalks. Children were operating lemonade stands and selling water from portable coolers. You couldn’t walk more that 10 feet without someone going the other direction saying “Hey! Joe Mauer!” Former players such as Fergie Jenkins were signing autographs. There were half a dozen baseball card shops selling memorabilia of the greats, from game-used gloves and bats, to autographed jerseys, to baseball movie-inspired gear.
The induction itself took place in a large field a mile or so outside of town, as Cooperstown only has around 2000 residents outside of HOF-weekend, and tens of thousands descend from near and far to celebrate the game most of us have loved since we were children.
At the ceremony, prior to the new inductees being introduced, some 45 other HOFers were brought to the stage and their accomplishments were celebrated briefly. The Twins were well-represented, with Tony O, Rod Carew, Dave Winfield, Jack Morris, Jim Kaat, Paul Molitor, David Ortiz, and Jim Thome all present. These players received some of the loudest standing ovations from the crowd. Rob Manfred and Bud Selig were also introduced, and they were the only people to be booed by the audience, which…seems right.
Helton’s speech was the funniest, telling stories about his superstitions and his facial hair. Leyland’s was the most emotional, as the crusty baseball lifer got choked up multiple times as he reflected on the game. Beltre celebrated the teammates he loved to play with. Mauer’s speech was the most…Mauer. Joe’s humility was striking. Unlike the others, he did not share baseball anecdotes. He didn’t crack jokes. He instead focused on thanking everyone else - from the scouts, to his family, his high school coaches, and medical staff, Mayo Clinic doctors, and trainers that believed in him throughout his career. He built in pauses for people to applaud those others, and when the cheering wasn’t to his liking, he implored the audience to cheer louder and longer for those who see important to him. He even claimed his mom was the best athlete in the family. In typical Mauer fashion, he chose to stay out of the spotlight - even on a day honoring him.
It will likely be at least 15 years before we see another player enter the hall as a member of the Twins, and that’s if a lot of things break right. It’ll likely be even longer waiting for another player as special as Mauer to come along. Even if you don’t have a chance to see one of your favorite players being inducted, Cooperstown is still well-worth a visit, as the museum can entertain for hours, with every turn presenting another artifact that brings back baseball memories.
Abner Doubleday field is also just a block or so away from the Baseball Hall. This field over 100 years old, and is on the spot where he (apocryphally) invented the game of baseball.
Comment below if you were at the induction today, or if you have a favorite Mauer memory you want to share!
-
 Eric Blonigen got a reaction from ashbury for a blog entry, A weekend in Cooperstown - Joe Mauer’s HOF induction
Over the past few days, there have been some great articles written about Mauer’s accomplishments - the batting titles, the MVP season, the records, and the magic he brought to life on a near-daily basis for 15 years.
Today, he was deservingly enshrined in the Baseball Hall of Fame alongside Todd Helton, Adrian Beltré, and Manager Jim Leyland in Cooperstown, New York. I was fortunate enough to be present for it.
Being there was an amazing experience. That is likely true for a number of other members of Twins Territory as well. Anecdotally, close to half of the fans in attendance wearing jerseys, team shirts, or other memorabilia were repping Mauer.
The whole weekend was a celebration of baseball legends, with a parade on Saturday, the induction today, and a speaker’s series taking place tomorrow with a Q&A panel with this year’s inductees.
Walking through the picturesque small-town downtown area, there were over a dozen cash-only vendors selling hot dogs and burgers they were grilling along the sidewalks. Children were operating lemonade stands and selling water from portable coolers. You couldn’t walk more that 10 feet without someone going the other direction saying “Hey! Joe Mauer!” Former players such as Fergie Jenkins were signing autographs. There were half a dozen baseball card shops selling memorabilia of the greats, from game-used gloves and bats, to autographed jerseys, to baseball movie-inspired gear.
The induction itself took place in a large field a mile or so outside of town, as Cooperstown only has around 2000 residents outside of HOF-weekend, and tens of thousands descend from near and far to celebrate the game most of us have loved since we were children.
At the ceremony, prior to the new inductees being introduced, some 45 other HOFers were brought to the stage and their accomplishments were celebrated briefly. The Twins were well-represented, with Tony O, Rod Carew, Dave Winfield, Jack Morris, Jim Kaat, Paul Molitor, David Ortiz, and Jim Thome all present. These players received some of the loudest standing ovations from the crowd. Rob Manfred and Bud Selig were also introduced, and they were the only people to be booed by the audience, which…seems right.
Helton’s speech was the funniest, telling stories about his superstitions and his facial hair. Leyland’s was the most emotional, as the crusty baseball lifer got choked up multiple times as he reflected on the game. Beltre celebrated the teammates he loved to play with. Mauer’s speech was the most…Mauer. Joe’s humility was striking. Unlike the others, he did not share baseball anecdotes. He didn’t crack jokes. He instead focused on thanking everyone else - from the scouts, to his family, his high school coaches, and medical staff, Mayo Clinic doctors, and trainers that believed in him throughout his career. He built in pauses for people to applaud those others, and when the cheering wasn’t to his liking, he implored the audience to cheer louder and longer for those who see important to him. He even claimed his mom was the best athlete in the family. In typical Mauer fashion, he chose to stay out of the spotlight - even on a day honoring him.
It will likely be at least 15 years before we see another player enter the hall as a member of the Twins, and that’s if a lot of things break right. It’ll likely be even longer waiting for another player as special as Mauer to come along. Even if you don’t have a chance to see one of your favorite players being inducted, Cooperstown is still well-worth a visit, as the museum can entertain for hours, with every turn presenting another artifact that brings back baseball memories.
Abner Doubleday field is also just a block or so away from the Baseball Hall. This field over 100 years old, and is on the spot where he (apocryphally) invented the game of baseball.
Comment below if you were at the induction today, or if you have a favorite Mauer memory you want to share!
-
 Eric Blonigen got a reaction from Karbo for a blog entry, The Twins All-Star All Decade Teams - Part 3 - The 1980s
Welcome to part three of this series, in which we look at the all-decade teams comprised of only guys selected to an All-Star team in that decade. You can refer to part 1 for the full methodology. Without further ado, let’s dig into the 1980s. Can they overthrow the 1960s all-decade team?
The 1980s Twins Teams
Oh, the 80s. We saw the introductions of franchise greats like Kirby Puckett, Kent Hrbek, and others. In 1988, the Twins set a league record for making the fewest errors in a season. They also won the World Series in ’87. Aside from those few bright spots, it was not the Twins’ finest decade. We saw the opening of the Metrodome, in all it’s astroturf and bathroom trough glory. 1984 saw the Pohlads attempt to take advantage of an attendance clause in their lease that said if they didn’t draw enough fans, they could vacate the lease and move the team. Sound like the plot of Major League? Yeah, I thought so too. The decade also featured several pretty bad seasons.
How did the all-decade team stack up? To this point, the 1960s all-decade team is pacing every other decade’s team. Can the few 80s superstars get it done? Let’s dig in.
Starting Pitchers
SP1 - Frank Viola - 1988. He was the ace. Fresh off his epic 1987 World Series run, Sweet Music went 24-7 en route to his only All-Star selection as a member of the Twins. He had a 2.64 ERA and a 154 ERA+, a 1.1 WHIP, and a minuscule 1.8 BB/9. He won the Cy Young for his efforts. In the midst of a four-year peak, he won more games as a lefty than anyone else in baseball, and the third most overall behind Doc Gooden and Jack Morris. Over that stretch, he won 19 straight home games. Not too shabby. He had a contract dispute and was traded midway through the season in a blockbuster with the Mets that brought three players, includingRick Aguilera and Kevin Tapani, who would go on to be members of the '91 World Series team.
Unfortunately, after Viola, there were no other SP selected for an All-Star nod. The ace stands alone.
Relief Pitchers
CL - Jeff Reardon - 1988. The ‘80s did bring a bullpen ace into the mix as The Terminator found his way into 63 games, pitching to a 2.47 ERA. He was 65% better than league average, and received down-ballot MVP votes as a reliever. He had an 80-54 SO/BB ratio. That year, he was featured on the cover of Street & Smith’s annual Baseball Yearbook. A few years later, he would eventually become the all-time saves leader, although he didn’t remain on top for long. In 1988, he was also the first pitcher to record 40-save seasons in both leagues.
Lineup
Here we saw a number of mainstays that were also on the ’91 WS team.
C - Tim Laudner - 1988. This was his only All-Star nod, and even in this season, he was just sort of mediocre. Despite only accumulating 3.2 career WAR and just 1.1 in his All-Star year, he’s the only catcher selected to an AS team that decade. He was a league-average hitter, but performed poorly when it mattered, finishing the season with a -1.2 WPA. There was nothing notable about this season, or about him as a player. Sorry Tim. He was fine on broadcasts and did go to my High School, so there’s that.
1B - Kent Hrbek - 1982 in his lone selection. Notably, he told MLB not to pick him moving forward. However, in 1982, along with finishing 2nd in the Rookie of the Year voting, he was an All-Star. As a 22-year-old, he hit 28% better than league average, hitting .301 on the year. He also swiped three bags.
3B - Gary Gaetti, “The Rat” - 1988. A member of the ’87 World Series team, he won a Gold Glove in the 1988 season, the third consecutive season in which he accomplished that. He also had a .905 OPS, hit over .300 for the only season in his career, and clubbed 28 homers. He was known for being the energy-bringer to the clubhouse. After the season, Sports Illustrated ran an article in which they surveyed all AL Managers who they thought the best third baseman in the league was, and 10 of them said Gaetti. Fun fact, he recording his final major league hit off of Johan Santana.
OF - Kirby Pickett - 1988, his third time making the team. It was a great season for him as he led the league in hits (234), total bases (358), hit .356 (the best RH batting average since Joe DiMaggio in 1941), hit 24 home runs, and won the Gold Glove in centerfield. He also won the Silver Slugger, and finished 3rd in MVP balloting in his 7.8 WAR campaign. He notched his 1000th hit in ’88, in just his 5th season. He was the 4th player in history to reach that accomplishment. And, maybe most importantly, I ran into Kirby in 1988 at a Red Owl grocery store. That was the highlight of my 5-year-old life to that point, as I got his autograph on a napkin. He was a lot of fun to watch, and to meet. As Twins fans know all-too-well, he was yet another Twins superstar whose career was cut short by injuries.
OF - Gary Ward - 1983. While he didn’t put up any standout metrics, he was solid across the board offensively and defensively, above average everywhere you look. With Puckett’s emergence, Ward was traded after the season for a couple of starting pitchers that didn’t do much other than eat innings.
OF - Tom Brunansky - 1985. Similar to Laudner, Bruno didn’t really deserve to be an All-Star. His lone AS season featured slightly above average hitting with decent power at a 104 OPS+, but well-below-average defense. He finished with 1.4 WAR, below the threshold of being an everyday player. He did participate in the first-ever Home Run Derby, finishing sexond. He had two claims to fame, but neither fell in this All-Star season. First, he was a part of the ’87 World Series team. Second, he once hit an inside-the-park grand slam.
On the whole, the 1980s all-decade team finished with just 32.5 WAR, with half of that belonging to Puckett and Viola. With the 52 replacement-level wins, the all-decade team finished at 84.5 wins, just above .500. Advantage: 1960s.
Before looking at the remaining decades, do you think the 80s all-decade team was the worst? Comment below, and stay tuned for tomorrow’s look at the 1990s.
-
 Eric Blonigen got a reaction from tarheeltwinsfan for a blog entry, The Twins All-Star All Decade Teams - Part 1 - The 1960s
With the All-Star break upon us, and no meaningful baseball for almost a week, I thought it could be a fun exercise to look at Twins All-Stars through the years (and decades). More than that, I was curious to see which decade has produced the best players. So, over the next several days, I will be writing a series of articles about these all-decade teams, and then looking at which team is the best.
For methodology, I will be looking at all Twins that made an All-Star team. Then, I will attempt to construct a roster with just those players. I will be calling these all-decade teams. If an all-decade team cannot fill a full roster, I will look at just the positions they could fill, and the openings would be filled by replacement players. If a player played multiple positions, I will only use the position they made the All-Star team at. If they were an All-Star at multiple positions in different seasons, they are fair game to be used twice - once at each position. If their career spanned multiple decades, they can be on multiple all-decade teams. I will limit SP to three, RP to three, and for OF positions, I will use them interchangeably. Finally, I will will look at the bWAR for each of those players’ best All-Star season in that decade and determine that all-decade team’s win total. For the 2020s, I’ll have to get a little unconventional. Since we are only halfway through this decade and cannot come close to filling out a full roster, I’ll double their bWAR to try to get close to parity.
By the end of this series, we will see which decade had the best win total through this completely arbitrary methodology.
Each article will look at one decade, from the team’s move to Minnesota in the 60s through today. Which team will come out on top?
Today, we will looking at the 1960s, with another decade being featured each day. Without further ado, let’s dig in!
The 1960s Twins Teams
1960 saw the Washington Senators move from Washington DC to Minnesota, changing their name to the Twins. Coming from DC, they came pre-loaded with guys like Harmon Killebrew, Jim Kaat, and Bob Allison. They also developed guys like Jimmie Hall, Tony Oliva, and Rod Carew, and traded for guys like Dean Chance and Cesar Tovar. The ‘60s Twins teams had a veritable who’s who of All-Stars, and a number of players in the Twins (and Baseball) Hall of Fame. They made it to the World Series in 1965 before losing to the Dodgers. They made it to the ALCS again in 1969 with Billy Martin as Manager. These teams were well before my time, but my dad talks all the time about these guys, and how how much he loved them as a kid.
But how was the all-decade team? Let’s look at the roster.
Starting Pitchers
For starting pitchers, we have the 1963 version of Camilo Pascual, the 1962 version of Jim Kaat, and the 1967 season for Dean Chance.
SP1 - Camilo Pascual - 1963. Pascual threw 267 innings with 14 complete games and struck out 7.2/9, which in those days was pretty good. In fact, it led the league! The curveball specialist pitched back to back shutouts three times that season, and 1963 also ended his 6-year run of having the highest collective pitching WAR in baseball. After he retired, he became a scout and signed Jose Conseco and Alex Cora.
SP2 - Jim Kaat - 1962. Kitty Kaat threw 16 complete games and 5 shutouts in 1962, with a 3.13 ERA and was 30% better than league average. The dominant lefty went on to become the all-time Twins leader in Wins and Ks, won 16 Gold Glove awards, was a part of the ’65 team that went to the World Series, and was eventually elected to the Baseball Hall of Fame in 2022.
SP3 - Dean Chance - 1967. He was a horse in 1967, leading the league in starts, complete games (18), innings pitched (283), and a 2.73 ERA bolstered by a 2.56 FIP. He there a no-hitter on 8/25/67, and a rain-shortened perfect game on 8/6. Imagine that level of performance, twice in a month. Must have been magical to see.
Relief Pitchers
There were no relief pitchers selected, but of course, relief pitchers weren’t really a thing in the 60s.
Lineup
The lineup was even more impressive than the starting pitching.
C - Earl Battey - 1963. This was Earl’s second of four All-Star appearances. He put up an .845 OPS and was 34% better than an average hitter. He took almost as many walks as strikeouts, and was solid behind the dish, winning a gold glove. He hit 26 HR as a catcher, and shockingly, that was just 4th best on the team that year. Have I mentioned the 60s had some great teams and even better players? Battey also gathered down ballot MVP votes, and eventually went on to play in the ’65 World Series-losing team.
1B - Harmon Killebrew - 1965. It was actually sort of a down year for him, but it was still very good. He slugged .501, finished with a 145 OPS+, and took 72 walks. When I was a kid, I was always very excited to bike to a gas station and see they had Killebrew root beer for sale. Turns out he was incredible at hitting, and the Killer was the best slugger in baseball for much of his tenure.
2B - Rod Carew - 1969. In his age-23 season, he won his first batting title, put up an .853 OPS, and received down-ballot MVP votes. Oh, and he stole home seven times. Not a misprint, just incredible. Five times, he did it in the first inning. And, he did it by mid-July. He was a key reason the Twins won the AL West title that season. Sadly, Carew began the Twins trend of suffering a debilitating injury the following season, shredding his knee in a collision at 2nd base.
3B - Harmon Killebrew - 1961. In 1961, Hammerin’ Harmon Killebrew was incredible manning the hot corner. He finished with an OPS over 1.000, took 107 walks, launched 46 HR, and knocked in 122. He even stole a base. His WRC+ was 160.
SS - Zoila Versailles - 1965. In his MVP-winning 1965 season, he led the league in WAR (7.2), plate appearances (728), runs (126), doubles (45), triples (12), and total bases (308). He hit to a 115 OPS+ as a slick-fielding shortstop, and he won his second Gold Glove that season as well. In the World Series, he led the team with 8 hits, including a three-run bomb. He was also the first latin-born player to win the MVP. He suffered a back injury and declined shortly after this season, but that year, he was great.
OF - Harmon Killebrew - 1964. The 60s all-decade team benefits greatly from the incredible slugger’s positional flexibility (or moving down the defensive spectrum). He makes his third appearance on this team playing the outfield. In 1964, he took the home run crown, finished with a .924 OPS, took 93 walks, and also led the league in HBP.
OF - Jimmie Hall -1965. He had an .810 OPS, had a 79/51 K/BB ratio, and played solid defense. As part of the ’65 World Series team, he received 7 ABs and struck out in 5 of them. He was beaned and declined after the season, turning into a role player. Yet another promising player derailed by injuries.
OF - Tony Oliva - 1964. He led the league in hits (217), runs (109), doubles (43), batting average (.323), and total bases. He also won Rookie of the Year, and came in 4th in MVP voting. Tough to beat.
This all-decade team accumulated 62.3 WAR. As replacement-level teams win approximately 52 games according to BBRef, the 1960s all-decade team would have come through with 114.3 wins.
Did the 60s have the best Twins players of all time? Can another decade top 114.3 wins? Check back tomorrow to see how the 70s showed up! And, comment below to share your thoughts on this activity.
-
 Eric Blonigen got a reaction from Dman for a blog entry, What went wrong for David Festa?
What went wrong for David Festa?
David Festa —AKA The Slim Reaper — has had a lot of prospect helium over the past season and a half. Since being drafted in the 13th round in 2021, he has added a few MPH to his fastball, and greatly improved his secondary pitches to the point that he is now the 89th best prospect in baseball, according to MLB.com. He put up video game numbers in St Paul, setting strikeout records. He briefly walked too many guys, but seemed to solve that problem after a few starts, and his results suggested he was ready to join the Twins rotation permanently.
However, he was optioned back to St Paul following two sub-par starts, in which he gave up 12 runs in 10 innings. He allowed 4 home runs, had a WHIP of 1.7, an ERA+ of just 39, and was worth -.5 WAR. Even his FIP doesn’t look much better, at 7.07.
Is this a case of a talented rookie feeling some nerves, or a sign that there’s still some developmental work to do before his next callup? Was he approaching things differently than he did in his time at St Paul? Let’s take a look at some underlying data.
First, let’s look at his stuff, beginning with his fastball. From a velocity standpoint, he was better than average, grading out in the 75th percentile. His extension is in the 93rd percentile, giving the illusion of even more velocity. His fastball spin averaged 2349 RPM, which is average. However, his heater has MUCH less movement than typical. His 4-seam drops 12” as it crosses the plate, compared to a 15” league average. That part is fine. It also approaches hitters on a very straight trajectory, moving in just 2 inches compared to a 7” average. Major league hitters can crush straight fastballs, regardless of how hard they are thrown, and his fastball results bear that out. He gave up a .385 BA and a .615 slugging on that pitch, turning every hitter he faced into Aaron Judge. Not great.
How about his off-speed pitches? His slider and changeup both had above-average velo, and typical spin rates. Similar to his heater, he did not get the movement required to be successful at the Major-league level. His slider moved away from same-sided hitters just two inches, compared to a league-average 6 inches. His changeup dropped just 25” compared to a 32” league average. That said, his changeup is his only pitch that showed up as average-ish, with just a .318 xWOBA and a 33% whiff rate, but a .500 expected slugging percentage.
While Festa limited free passes at a much-better-than-average rate, pounded the zone, and hit his spots at the edges of the zone, he did not show swing and miss stuff, generating just 21% whiffs. And, hitters barreled his pitches at MORE THAN DOUBLE the league average. Part of this can be attributed to location, as he left too many pitches over the heart of the plate.
Despite all this, he did find success his first time through the order, allowing just a .5 WHIP through the first two innings of both starts. After that, the wheels fell off, with a 3.0 WHIP in innings 3 and 4.
He also struggled to get the third out, regardless of inning, giving up a 3.3 WHIP with two outs. Interestingly, his two-out and second time through the order struggles were true of his time at AAA as well, which doesn’t bode well for the future.
It’s just not possible to be successful at this level without either swing and miss stuff, or elite command and control. This story this tells is that Festa likely has some work to do to increase spin, movement, or locating his pitches. Or, perhaps he would find better results out of the bullpen where he would be less exposed, and could dial up the velocity even a bit further.
What do you think? Is Festa destined to be a AAAA-type pitcher? Are there mechanical changes that can improve the movement of his pitches? Should he adjust his pitch mix, or his sequencing? Should he move to the bullpen? Or is all this a case of nerves? Comment below!
-
 Eric Blonigen reacted to ashbury for a blog entry, How many wins has Rocco cost the Twins in 2024?
We all know Rocco is costing the Twins a chance for a win, every time he fills out the lineup card or comes out to make a pitching change. And don't get me started on his pinch-hitting choices. So, put a number on it. How many needless losses are on Rocco, so far this season?
-
 Eric Blonigen got a reaction from Richie the Rally Goat for a blog entry, First half LEAST valuable players by win probability added
As we have recently crossed the halfway point of the 2024 season, my next two posts will be taking a look at our most (and least) valuable players by win probability added (or subtracted). We will also take a look at some signature moments that led to this WPA. As with any stat, WPA is not perfect. It’s not predictive, and doesn’t really measure skill level. However, it’s a great shorthand to evaluate players relative value to the team through their performance when it matters most. To oversimplify things greatly, being worth .5 WPA is roughly equivalent to a win. Read on to see if there are any surprises!
We will begin by looking at the five least valuable players of the first half. Nothing here surprised me based on the eye test, or looking at their WAR. Without further ado, we will start with the player who has helped the team the least so far this season.
Christian Vazquez - C - (-1.75 WPA)
Vasquez has not been good, by any measuring tool. He’s been the worst hitter by WAR, and it’s not close. In fact, his OPS+ has been historically bad. Think Drew Butera territory, then lose another 50 points of OPS and you are in the ball park. Somewhat interestingly, he hasn’t even really had any individual good games. His best single game increased the team’s chances to win by just 11%. Most of his games have been negative. To compound things, he has come up to bat in some key moments. Spoiler: he generally has not come through. And, by WPA, he has cost the team three and a half wins so far.
Steven Okert - RP (-.78 WPA)
Okert hasn’t been great, but he also has been very un-clutch. So far this season, in limited action, he has had four bad games. The worst was on 5/6, when he decreased their chances to win by 44% - almost an entire loss on his shoulders. Okert came into the game against the Mariners with the Twins up 4-2 and the bases loaded. It began as Jay Jackson’s mess, but Okert immediately gave up a grand slam and the Twins went on to lose.
Louis Varland - SP (-.76 WPA)
It’s telling that despite Varland’s last two spot starts being solid or better, he is still very negative in WPA on the season. His first starts of April prior to his demotion were just that bad. Consider the following: in three of his four April starts, he cost the team at least a 25% likelihood to win the game. The worst was on 4/15 against the Orioles, when his WPA was -.34 due to allowing 11 hits, 2 HR, and 4 runs over 5 innings. Tough to win against a good team in that situation. Of course, he was demoted immediately following this start, and may be figuring out his form again after his stint at STP.
Kyle Farmer - IF (-.66 WPA)
Team leader? Yes. Versatile? Sure. A good hitter? Maybe not any more. Similar to Vazquez, the problem is he just hasn’t had many good games to balance the bad ones. His worst, in limited action, was on 4/13 against the Tigers. While the Twins won, it was no thanks to Farmer’s performance. He struck out with the bases loaded in the top of the 12th inning. Luckily, the rest of the team showed up to batting practice and the Twins scored 7 runs in the 12th for the win. His playing time has slumped along with his performance, and the end may be near for him.
Manny Margot - OF (-.63 WPA)
Yes, Manny Margot has been much better for the past month. However, it will take him a couple more months at this level just to reach a neutral WPA. He was just that bad for April and May. Funnily enough, his worst game was the same as Farmer’s. He went 0-fer and left runners on base multiple times.
Stay tuned for tomorrow, and the recap of our top-5 WPA leaders in the first half.
What do you think? Did any of these players surprise you? Will any of the bottom performers turn it around in the second half? Comment below to start the discussion!
-
Eric Blonigen got a reaction from Richie the Rally Goat for a blog entry, First half MOST valuable players by win probability
In my last article, we looked at the bottom-5 performers by WPA at the halfway point. Today, we will look at the top performers. We will also take a look at some signature moments that led to this WPA. As a reminder, as with any stat, WPA is not perfect. It’s not predictive, and doesn’t really measure skill level. However, it’s a great shorthand to evaluate players relative value to the team through their performance when it matters most. To oversimplify things greatly, being worth .5 WPA is roughly equivalent to a win. Read on to see if there are any surprises!
In this group, there were two names that surprised me. Sometimes being clutch is sneaky! Let's start with the player who has increased the team's chances to win by more than any other player this season.
Carlos Correa - SS (1.45 WPA)
In case you were wondering, it did not surprise me that Correa is leading the team - he has been on fire for most of the season. His OPS+ is second-highest of his career, and for the past month, has been one of the strongest hitters in baseball, and he has been clutch. It’s a testament to his consistency that he has had four separate games in which he increased the team’s win probability by at least 25%. His signature moment so far happened on 5/30 against the Royals. Correa batted in the 5th with the bases loaded and the game tied at 4. Cut to a bases-clearing triple, and the bullpen saved the game for a key win against a divisional foe. Correa increased the chances for a Twins victory by 40% in that game, almost an entire win.
Jhoan Duran - RP (1.19 WPA)
This one surprised me quite a bit. As I have previously written about, Duran has been shaky this year (at least compared to his talent level and the past couple years). His velocity has been down, he hasn’t been locating his pitches in an optimal way, and he has blown saves at a higher rate than in years past. His bWAR is also negative on the year, and tied for worst on the team at -.3. However, situationally, he has still gotten it done more than it might seem. His best moment this season happened on 6/14. Duran came into a tie game in the 9th and increased the Twins’ chances to win by 45% when he pitched a scoreless 9th - and 10th - sending the As down in order to win the game.
Simeon Woods Richardson - SP (1.19 WPA)
SWR has been good, and this is backed up by his WPA. He has increased the team’s chances to win in 10/13 starts so far. His best game was on 5/6, when he threw 6 strong innings against the Mariners, giving up just a single hit and one walk, while striking out 8. The team won 3-1, and SWR increased their odds by 36%. Not bad for a rookie’s fourth start, and against one of the best teams in the AL!
Willi Castro - UTIL (1.18 WPA)
No surprises here. Castro has been playing out of his mind this season and is leading the team in bWAR at 2.9. He could be in line for his first All-star bid. Interestingly, Castro has only had one big WPA game this season, and it didn’t result in a Twins win. On 6/21, Castro batted in the 7th with the Twins down 2 runs, and hit a 3-run bomb to take the lead. Unfortunately, the bullpen immediate gave up the lead.
Ryan Jeffers - C (1.09 WPA)
Jeffers, while slumping for the past month, has still been one of the best-hitting catchers in the league. He has had many clutch moments, including 4/12 against the Tigers, where he increased the chances of a Twins victory by a whopping 73%. He hit a homer to tie the game in the 7th, then knocked in Carlos Santana an inning later to take the lead. Later, he reached on an error when the game was re-tied, then came around to score for the lead once again. This was the Ryan Jeffers game.
What do you think? Did any of these players surprise you? Will any of the top performers cool off? Comment below to start the discussion!
-
 Eric Blonigen got a reaction from MMMordabito for a blog entry, First half LEAST valuable players by win probability added
As we have recently crossed the halfway point of the 2024 season, my next two posts will be taking a look at our most (and least) valuable players by win probability added (or subtracted). We will also take a look at some signature moments that led to this WPA. As with any stat, WPA is not perfect. It’s not predictive, and doesn’t really measure skill level. However, it’s a great shorthand to evaluate players relative value to the team through their performance when it matters most. To oversimplify things greatly, being worth .5 WPA is roughly equivalent to a win. Read on to see if there are any surprises!
We will begin by looking at the five least valuable players of the first half. Nothing here surprised me based on the eye test, or looking at their WAR. Without further ado, we will start with the player who has helped the team the least so far this season.
Christian Vazquez - C - (-1.75 WPA)
Vasquez has not been good, by any measuring tool. He’s been the worst hitter by WAR, and it’s not close. In fact, his OPS+ has been historically bad. Think Drew Butera territory, then lose another 50 points of OPS and you are in the ball park. Somewhat interestingly, he hasn’t even really had any individual good games. His best single game increased the team’s chances to win by just 11%. Most of his games have been negative. To compound things, he has come up to bat in some key moments. Spoiler: he generally has not come through. And, by WPA, he has cost the team three and a half wins so far.
Steven Okert - RP (-.78 WPA)
Okert hasn’t been great, but he also has been very un-clutch. So far this season, in limited action, he has had four bad games. The worst was on 5/6, when he decreased their chances to win by 44% - almost an entire loss on his shoulders. Okert came into the game against the Mariners with the Twins up 4-2 and the bases loaded. It began as Jay Jackson’s mess, but Okert immediately gave up a grand slam and the Twins went on to lose.
Louis Varland - SP (-.76 WPA)
It’s telling that despite Varland’s last two spot starts being solid or better, he is still very negative in WPA on the season. His first starts of April prior to his demotion were just that bad. Consider the following: in three of his four April starts, he cost the team at least a 25% likelihood to win the game. The worst was on 4/15 against the Orioles, when his WPA was -.34 due to allowing 11 hits, 2 HR, and 4 runs over 5 innings. Tough to win against a good team in that situation. Of course, he was demoted immediately following this start, and may be figuring out his form again after his stint at STP.
Kyle Farmer - IF (-.66 WPA)
Team leader? Yes. Versatile? Sure. A good hitter? Maybe not any more. Similar to Vazquez, the problem is he just hasn’t had many good games to balance the bad ones. His worst, in limited action, was on 4/13 against the Tigers. While the Twins won, it was no thanks to Farmer’s performance. He struck out with the bases loaded in the top of the 12th inning. Luckily, the rest of the team showed up to batting practice and the Twins scored 7 runs in the 12th for the win. His playing time has slumped along with his performance, and the end may be near for him.
Manny Margot - OF (-.63 WPA)
Yes, Manny Margot has been much better for the past month. However, it will take him a couple more months at this level just to reach a neutral WPA. He was just that bad for April and May. Funnily enough, his worst game was the same as Farmer’s. He went 0-fer and left runners on base multiple times.
Stay tuned for tomorrow, and the recap of our top-5 WPA leaders in the first half.
What do you think? Did any of these players surprise you? Will any of the bottom performers turn it around in the second half? Comment below to start the discussion!
-
Eric Blonigen got a reaction from Karbo for a blog entry, First half LEAST valuable players by win probability added
As we have recently crossed the halfway point of the 2024 season, my next two posts will be taking a look at our most (and least) valuable players by win probability added (or subtracted). We will also take a look at some signature moments that led to this WPA. As with any stat, WPA is not perfect. It’s not predictive, and doesn’t really measure skill level. However, it’s a great shorthand to evaluate players relative value to the team through their performance when it matters most. To oversimplify things greatly, being worth .5 WPA is roughly equivalent to a win. Read on to see if there are any surprises!
We will begin by looking at the five least valuable players of the first half. Nothing here surprised me based on the eye test, or looking at their WAR. Without further ado, we will start with the player who has helped the team the least so far this season.
Christian Vazquez - C - (-1.75 WPA)
Vasquez has not been good, by any measuring tool. He’s been the worst hitter by WAR, and it’s not close. In fact, his OPS+ has been historically bad. Think Drew Butera territory, then lose another 50 points of OPS and you are in the ball park. Somewhat interestingly, he hasn’t even really had any individual good games. His best single game increased the team’s chances to win by just 11%. Most of his games have been negative. To compound things, he has come up to bat in some key moments. Spoiler: he generally has not come through. And, by WPA, he has cost the team three and a half wins so far.
Steven Okert - RP (-.78 WPA)
Okert hasn’t been great, but he also has been very un-clutch. So far this season, in limited action, he has had four bad games. The worst was on 5/6, when he decreased their chances to win by 44% - almost an entire loss on his shoulders. Okert came into the game against the Mariners with the Twins up 4-2 and the bases loaded. It began as Jay Jackson’s mess, but Okert immediately gave up a grand slam and the Twins went on to lose.
Louis Varland - SP (-.76 WPA)
It’s telling that despite Varland’s last two spot starts being solid or better, he is still very negative in WPA on the season. His first starts of April prior to his demotion were just that bad. Consider the following: in three of his four April starts, he cost the team at least a 25% likelihood to win the game. The worst was on 4/15 against the Orioles, when his WPA was -.34 due to allowing 11 hits, 2 HR, and 4 runs over 5 innings. Tough to win against a good team in that situation. Of course, he was demoted immediately following this start, and may be figuring out his form again after his stint at STP.
Kyle Farmer - IF (-.66 WPA)
Team leader? Yes. Versatile? Sure. A good hitter? Maybe not any more. Similar to Vazquez, the problem is he just hasn’t had many good games to balance the bad ones. His worst, in limited action, was on 4/13 against the Tigers. While the Twins won, it was no thanks to Farmer’s performance. He struck out with the bases loaded in the top of the 12th inning. Luckily, the rest of the team showed up to batting practice and the Twins scored 7 runs in the 12th for the win. His playing time has slumped along with his performance, and the end may be near for him.
Manny Margot - OF (-.63 WPA)
Yes, Manny Margot has been much better for the past month. However, it will take him a couple more months at this level just to reach a neutral WPA. He was just that bad for April and May. Funnily enough, his worst game was the same as Farmer’s. He went 0-fer and left runners on base multiple times.
Stay tuned for tomorrow, and the recap of our top-5 WPA leaders in the first half.
What do you think? Did any of these players surprise you? Will any of the bottom performers turn it around in the second half? Comment below to start the discussion!
-
 Eric Blonigen got a reaction from RpR for a blog entry, First half LEAST valuable players by win probability added
As we have recently crossed the halfway point of the 2024 season, my next two posts will be taking a look at our most (and least) valuable players by win probability added (or subtracted). We will also take a look at some signature moments that led to this WPA. As with any stat, WPA is not perfect. It’s not predictive, and doesn’t really measure skill level. However, it’s a great shorthand to evaluate players relative value to the team through their performance when it matters most. To oversimplify things greatly, being worth .5 WPA is roughly equivalent to a win. Read on to see if there are any surprises!
We will begin by looking at the five least valuable players of the first half. Nothing here surprised me based on the eye test, or looking at their WAR. Without further ado, we will start with the player who has helped the team the least so far this season.
Christian Vazquez - C - (-1.75 WPA)
Vasquez has not been good, by any measuring tool. He’s been the worst hitter by WAR, and it’s not close. In fact, his OPS+ has been historically bad. Think Drew Butera territory, then lose another 50 points of OPS and you are in the ball park. Somewhat interestingly, he hasn’t even really had any individual good games. His best single game increased the team’s chances to win by just 11%. Most of his games have been negative. To compound things, he has come up to bat in some key moments. Spoiler: he generally has not come through. And, by WPA, he has cost the team three and a half wins so far.
Steven Okert - RP (-.78 WPA)
Okert hasn’t been great, but he also has been very un-clutch. So far this season, in limited action, he has had four bad games. The worst was on 5/6, when he decreased their chances to win by 44% - almost an entire loss on his shoulders. Okert came into the game against the Mariners with the Twins up 4-2 and the bases loaded. It began as Jay Jackson’s mess, but Okert immediately gave up a grand slam and the Twins went on to lose.
Louis Varland - SP (-.76 WPA)
It’s telling that despite Varland’s last two spot starts being solid or better, he is still very negative in WPA on the season. His first starts of April prior to his demotion were just that bad. Consider the following: in three of his four April starts, he cost the team at least a 25% likelihood to win the game. The worst was on 4/15 against the Orioles, when his WPA was -.34 due to allowing 11 hits, 2 HR, and 4 runs over 5 innings. Tough to win against a good team in that situation. Of course, he was demoted immediately following this start, and may be figuring out his form again after his stint at STP.
Kyle Farmer - IF (-.66 WPA)
Team leader? Yes. Versatile? Sure. A good hitter? Maybe not any more. Similar to Vazquez, the problem is he just hasn’t had many good games to balance the bad ones. His worst, in limited action, was on 4/13 against the Tigers. While the Twins won, it was no thanks to Farmer’s performance. He struck out with the bases loaded in the top of the 12th inning. Luckily, the rest of the team showed up to batting practice and the Twins scored 7 runs in the 12th for the win. His playing time has slumped along with his performance, and the end may be near for him.
Manny Margot - OF (-.63 WPA)
Yes, Manny Margot has been much better for the past month. However, it will take him a couple more months at this level just to reach a neutral WPA. He was just that bad for April and May. Funnily enough, his worst game was the same as Farmer’s. He went 0-fer and left runners on base multiple times.
Stay tuned for tomorrow, and the recap of our top-5 WPA leaders in the first half.
What do you think? Did any of these players surprise you? Will any of the bottom performers turn it around in the second half? Comment below to start the discussion!
-
Eric Blonigen got a reaction from Karbo for a blog entry, Introducing: Little Papi
Twins fans of a certain age still bear the wounds of Terry Ryan non-tendering David Ortiz prior to the 2003 season prior to his first year of arbitration. Ryan was infamous for this — saving ownership money even when he didn’t have that specific mandate. After the non-tender, Ortiz, of course, went on to become Big Papi. He led the Red Sox to multiple World Series titles. Over his career, he was a 10x All-Star, and won Silver Slugger at DH no fewer than 6 times. He’s in the Hall of Fame, and went on to accumulate over 50 bWAR.
This article is not about David Ortiz, however. It’s about another player who was non-tendered, and this time, the Twins were the beneficiary. We are, of course, talking about Willi Castro. As you read on, you will see a direct side-by-side comparison of the two players who found themselves in similar situations, for similar reasons, two decades apart.
To be clear, Ortiz and Castro are not similar players. One was a hulking slugger with a great eye at the plate, and the other is a toolsy, speedy utility player. As such, we won’t be looking at hitting profiles or batted ball data. What we will be looking at are some commonalities in the value they provided (and in Castro’s case, continue to provide) their respective teams.
First, let’s look at Ortiz’ last season with the Twins, and the first two seasons after the Red Sox signed him.
Next, here’s the same time window for Castro - his last season with the Tigers, and his first season and change with the Twins.
Looking just at this data, a few things stand out.
The bWAR they produced over the three year stretch is strikingly similar. Ortiz was slightly more valuable over that stretch, but it’s close. If Castro continues his production for the first half of this season, he is set to outpace Ortiz’ first All-Star season in 2004, during which he won Silver Slugger and received down ballot MVP votes. The teams’ winning percentages are also almost identical when they are playing. Again, Castro has a very slight edge over Ortiz. Castro is a year younger than Ortiz was in his second season with the Red Sox, and Castro is just hitting his prime. Castro, of course, has also been much cheaper - this season, he’s making maybe a third of what Ortiz was making, adjusted for inflation, in 2004. After unpacking all of this, it seems that Willi Castro is deserving of a new nickname - Little Papi.
Will he have a HOF-worthy career like Big Papi, or is this the best he has to offer? Realistically, the latter is more realistic. However, it’s great to be the recipient of another team’s self-scouting error, and it helps the Twins’ changes for a deep postseason run when they can find this kind of surplus value - and in general, when they can sign a borderline All-Star for next to nothing. He has been one of the Twins’ most consistent - and valuable - players over the past year of a half, and his style of play brings a different dynamic than many of their other players. He has also brought tremendous defensive flexibility, playing every position so far this season except 1B and C.
Should my Little Papi nickname stick? Is it a fun comparison? What do you think about the surplus value he has added with his bat, speed, and versatility? Comment below with your thoughts!
-
Eric Blonigen got a reaction from Karbo for a blog entry, Is Royce Lewis really THIS good?
Is Royce Lewis for real?
If you were to survey every Twins fan around their favorite current player, Royce Lewis would likely be near the top - and for good reason. So far this season, Royce Lewis has been doing very Royce Lewis things - being a spark plug for the offense, hitting a ton of bombs, and generally doing everything right. On a nearly daily basis, he is being recognized on the TV and radio broadcasts for doing things that just aren’t done. For example, he’s been hitting HRs at a higher rate than Barry Bonds. He’s one of just a handful of hitters to hit 10 HR in their first 16 games of a season. He’s been worth 1.6 bWAR in 16 games. You can go on an on. But, is he for real? Can he keep this up?
No. At least, probably not. Regression will come eventually. However, the drop-off may not be as big as you would think.
Looking at his batted ball data on Baseball Savant, there are a few things that stand out. First, check out all the red. Makes sense, since he’s been crushing. However, he’s also walking at an elite level, and striking out at an elite level too. He’s barreling up in the 100th percentile, and his bat speed is great.
Second, this isn’t a case of a young player being thrown a bunch of prove-it fastballs. Royce has been crushing pitches of EVERY type. As you can see, his expected batting average is over .300 across the board, and his actually performing the WORST against heaters. That’s unusual, and it’s a sign of his maturity at the plate, his pitch recognition, and his quick hands.
Third, his homers have not been wall-scrapers. Of his 10 homers so far this season, 70% have been no-doubters, and the others would have been out in most ballparks.
Fourth, looking at his year over year progress, we can see that this is a case of a young player, not yet hitting his prime, showing real improvement year over year, across the board. He’s swinging less outside the zone, he’s ambushing pitchers, and he’s optimizing his launch angle. In short, he’s got a sweet swing.
Finally, let’s take one gratuitous look at some player comps. Yes, this is a VERY small sample size. But, the comps on this list are also the short list of MVP favorites.
Looking at the batted ball data, and combining in with the eye test, what do you think? Is Lewis the best player on the team? Does he have MVPs in his future? Or will he fall back down to Earth? Start the discussion below!
-
 Eric Blonigen got a reaction from Parker Hageman for a blog entry, Jhoan Duran's pitching effectiveness - a deep dive
A month ago, Cody Christie wrote a great article around Jhoan Duran’s decreased velocity, and how that has impacted his pitch mix changes. A couple findings from that article were that:
His velocity is down roughly 1.2 MPH on every pitch compared to 2023, through mid-May. He’s been throwing his heater much less, and relying on his off-speed offerings more. At that time, he had decreased his fastball usage from 45% last year, to 34.3% this year through mid-May. Well, this trend has continued, and his results have gotten worse. Duran has not found his missing velo, and his fastball usage reduction has become even more extreme. Here are his past three games:
Last night, when pitching in back to back games, he only threw two 4-seam fastballs out of 10 pitches, and barely broke 100, at 100.1 and 100.4. The night before, Duran had a bit more gas, breaking 100 on all four fastballs (out of 15 pitches), with fastballs at 101.8, 101.1, 101.1, and 100.2. On Sunday, Duran threw fastballs four times, and failed to break 100 on two of them. What this tells us is that recently, his fastball usage is down to around 25%, and his velocity is down even more. While Cody’s article focused on velo and pitch mix, this article is going to take a deep dive into his pitch effectiveness and some pitch characteristics. To start that discussion, let’s take a look at his xwOBA throughout the season.
When Cody wrote his article, Duran’s xwOBA was sitting at .237, on a league average of just over .300. Today, his xwOBA is sitting at .281. That’s still better than league average, but it’s not world-beating any longer. But why?
Looking at Statcast and Baseball Savant data, so far this season, Duran has had only one effective pitch - his splinker. Throughout ’24, that is still a consistently great pitch for him. However, his fastball and his curve have both been much worse than typical for him, and rank poorly overall.
So, what has changed since last season, aside from his velocity dip? Last year, each of his offerings were good, and his splinker was GREAT. Digging deeper, we can see that this year, his overall chase rate is down almost 4%, and his whiff rate is down 4.6%. His strikeout rate is 2.3% less than last year (but his walk rate is down slightly as well. Batters are hitting him less hard, but they are also elevating the ball more, as evidenced by his ground ball rate dropping 5.5%. Overall, his xBA is up almost 30 points year over year.
But why? Let’s look at his fastball and curveball separately. We will start either his fastball.,
Fastball
This year, Duran'is fastball has lost some vertical drop compared to the average fastball, so it’s likely that hitters are perceiving the pitch as more crushable.
Location has also been a factor for his fastball success. See his heat map for last year - a lot of pitches up, leading to a lot of swing and miss.
This year however, his fastball is generally going much lower, and it’s resulting in a roughly .800 xOPS - not what you want to see out of one of the best pitchers in baseball.
Curveball
We can see that his curveball used to be a putaway pitch, but now isn’t.
Here, we can see that his spin rate is down on his curveball, losing about 100 RPM since last year. His splinker and fastball have both lost a little spin as well, but its not drastic. We can also see that his extension is down slightly, so that likely accounts for some perceived velocity loss in addition to the actual loss.
His pitch location also may be impacting his results. See these comparisons:
Here we can see that last year, Duran threw a lot of curveballs that missed just low, leading to more whiffs. This year, his curves are tending to miss VERY low, which helps to explain his decrease in effectiveness. If a batter know’s it’s a ball, they won’t swing, and there’s a pretty good chance that with some of these locations, they just know.
Overall, the story this all tells is that Duran is a great pitcher who is struggling with some mechanics, and locating his pitches where they are most effective. Even when throwing a little slower, he still ranks near the 100% percentile in velocity. His stuff will play. Here’s to hoping that he and the coaching staff can get the mechanics and the command back on track.
What do you think? Are better days ahead for the flamethrower?
-
 Eric Blonigen got a reaction from Hosken Bombo Disco for a blog entry, Jhoan Duran's pitching effectiveness - a deep dive
A month ago, Cody Christie wrote a great article around Jhoan Duran’s decreased velocity, and how that has impacted his pitch mix changes. A couple findings from that article were that:
His velocity is down roughly 1.2 MPH on every pitch compared to 2023, through mid-May. He’s been throwing his heater much less, and relying on his off-speed offerings more. At that time, he had decreased his fastball usage from 45% last year, to 34.3% this year through mid-May. Well, this trend has continued, and his results have gotten worse. Duran has not found his missing velo, and his fastball usage reduction has become even more extreme. Here are his past three games:
Last night, when pitching in back to back games, he only threw two 4-seam fastballs out of 10 pitches, and barely broke 100, at 100.1 and 100.4. The night before, Duran had a bit more gas, breaking 100 on all four fastballs (out of 15 pitches), with fastballs at 101.8, 101.1, 101.1, and 100.2. On Sunday, Duran threw fastballs four times, and failed to break 100 on two of them. What this tells us is that recently, his fastball usage is down to around 25%, and his velocity is down even more. While Cody’s article focused on velo and pitch mix, this article is going to take a deep dive into his pitch effectiveness and some pitch characteristics. To start that discussion, let’s take a look at his xwOBA throughout the season.
When Cody wrote his article, Duran’s xwOBA was sitting at .237, on a league average of just over .300. Today, his xwOBA is sitting at .281. That’s still better than league average, but it’s not world-beating any longer. But why?
Looking at Statcast and Baseball Savant data, so far this season, Duran has had only one effective pitch - his splinker. Throughout ’24, that is still a consistently great pitch for him. However, his fastball and his curve have both been much worse than typical for him, and rank poorly overall.
So, what has changed since last season, aside from his velocity dip? Last year, each of his offerings were good, and his splinker was GREAT. Digging deeper, we can see that this year, his overall chase rate is down almost 4%, and his whiff rate is down 4.6%. His strikeout rate is 2.3% less than last year (but his walk rate is down slightly as well. Batters are hitting him less hard, but they are also elevating the ball more, as evidenced by his ground ball rate dropping 5.5%. Overall, his xBA is up almost 30 points year over year.
But why? Let’s look at his fastball and curveball separately. We will start either his fastball.,
Fastball
This year, Duran'is fastball has lost some vertical drop compared to the average fastball, so it’s likely that hitters are perceiving the pitch as more crushable.
Location has also been a factor for his fastball success. See his heat map for last year - a lot of pitches up, leading to a lot of swing and miss.
This year however, his fastball is generally going much lower, and it’s resulting in a roughly .800 xOPS - not what you want to see out of one of the best pitchers in baseball.
Curveball
We can see that his curveball used to be a putaway pitch, but now isn’t.
Here, we can see that his spin rate is down on his curveball, losing about 100 RPM since last year. His splinker and fastball have both lost a little spin as well, but its not drastic. We can also see that his extension is down slightly, so that likely accounts for some perceived velocity loss in addition to the actual loss.
His pitch location also may be impacting his results. See these comparisons:
Here we can see that last year, Duran threw a lot of curveballs that missed just low, leading to more whiffs. This year, his curves are tending to miss VERY low, which helps to explain his decrease in effectiveness. If a batter know’s it’s a ball, they won’t swing, and there’s a pretty good chance that with some of these locations, they just know.
Overall, the story this all tells is that Duran is a great pitcher who is struggling with some mechanics, and locating his pitches where they are most effective. Even when throwing a little slower, he still ranks near the 100% percentile in velocity. His stuff will play. Here’s to hoping that he and the coaching staff can get the mechanics and the command back on track.
What do you think? Are better days ahead for the flamethrower?
-
 Eric Blonigen got a reaction from Cody Christie for a blog entry, Jhoan Duran's pitching effectiveness - a deep dive
A month ago, Cody Christie wrote a great article around Jhoan Duran’s decreased velocity, and how that has impacted his pitch mix changes. A couple findings from that article were that:
His velocity is down roughly 1.2 MPH on every pitch compared to 2023, through mid-May. He’s been throwing his heater much less, and relying on his off-speed offerings more. At that time, he had decreased his fastball usage from 45% last year, to 34.3% this year through mid-May. Well, this trend has continued, and his results have gotten worse. Duran has not found his missing velo, and his fastball usage reduction has become even more extreme. Here are his past three games:
Last night, when pitching in back to back games, he only threw two 4-seam fastballs out of 10 pitches, and barely broke 100, at 100.1 and 100.4. The night before, Duran had a bit more gas, breaking 100 on all four fastballs (out of 15 pitches), with fastballs at 101.8, 101.1, 101.1, and 100.2. On Sunday, Duran threw fastballs four times, and failed to break 100 on two of them. What this tells us is that recently, his fastball usage is down to around 25%, and his velocity is down even more. While Cody’s article focused on velo and pitch mix, this article is going to take a deep dive into his pitch effectiveness and some pitch characteristics. To start that discussion, let’s take a look at his xwOBA throughout the season.
When Cody wrote his article, Duran’s xwOBA was sitting at .237, on a league average of just over .300. Today, his xwOBA is sitting at .281. That’s still better than league average, but it’s not world-beating any longer. But why?
Looking at Statcast and Baseball Savant data, so far this season, Duran has had only one effective pitch - his splinker. Throughout ’24, that is still a consistently great pitch for him. However, his fastball and his curve have both been much worse than typical for him, and rank poorly overall.
So, what has changed since last season, aside from his velocity dip? Last year, each of his offerings were good, and his splinker was GREAT. Digging deeper, we can see that this year, his overall chase rate is down almost 4%, and his whiff rate is down 4.6%. His strikeout rate is 2.3% less than last year (but his walk rate is down slightly as well. Batters are hitting him less hard, but they are also elevating the ball more, as evidenced by his ground ball rate dropping 5.5%. Overall, his xBA is up almost 30 points year over year.
But why? Let’s look at his fastball and curveball separately. We will start either his fastball.,
Fastball
This year, Duran'is fastball has lost some vertical drop compared to the average fastball, so it’s likely that hitters are perceiving the pitch as more crushable.
Location has also been a factor for his fastball success. See his heat map for last year - a lot of pitches up, leading to a lot of swing and miss.
This year however, his fastball is generally going much lower, and it’s resulting in a roughly .800 xOPS - not what you want to see out of one of the best pitchers in baseball.
Curveball
We can see that his curveball used to be a putaway pitch, but now isn’t.
Here, we can see that his spin rate is down on his curveball, losing about 100 RPM since last year. His splinker and fastball have both lost a little spin as well, but its not drastic. We can also see that his extension is down slightly, so that likely accounts for some perceived velocity loss in addition to the actual loss.
His pitch location also may be impacting his results. See these comparisons:
Here we can see that last year, Duran threw a lot of curveballs that missed just low, leading to more whiffs. This year, his curves are tending to miss VERY low, which helps to explain his decrease in effectiveness. If a batter know’s it’s a ball, they won’t swing, and there’s a pretty good chance that with some of these locations, they just know.
Overall, the story this all tells is that Duran is a great pitcher who is struggling with some mechanics, and locating his pitches where they are most effective. Even when throwing a little slower, he still ranks near the 100% percentile in velocity. His stuff will play. Here’s to hoping that he and the coaching staff can get the mechanics and the command back on track.
What do you think? Are better days ahead for the flamethrower?
-
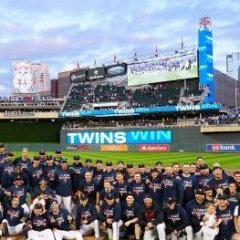 Eric Blonigen got a reaction from Patzky for a blog entry, Jhoan Duran's pitching effectiveness - a deep dive
A month ago, Cody Christie wrote a great article around Jhoan Duran’s decreased velocity, and how that has impacted his pitch mix changes. A couple findings from that article were that:
His velocity is down roughly 1.2 MPH on every pitch compared to 2023, through mid-May. He’s been throwing his heater much less, and relying on his off-speed offerings more. At that time, he had decreased his fastball usage from 45% last year, to 34.3% this year through mid-May. Well, this trend has continued, and his results have gotten worse. Duran has not found his missing velo, and his fastball usage reduction has become even more extreme. Here are his past three games:
Last night, when pitching in back to back games, he only threw two 4-seam fastballs out of 10 pitches, and barely broke 100, at 100.1 and 100.4. The night before, Duran had a bit more gas, breaking 100 on all four fastballs (out of 15 pitches), with fastballs at 101.8, 101.1, 101.1, and 100.2. On Sunday, Duran threw fastballs four times, and failed to break 100 on two of them. What this tells us is that recently, his fastball usage is down to around 25%, and his velocity is down even more. While Cody’s article focused on velo and pitch mix, this article is going to take a deep dive into his pitch effectiveness and some pitch characteristics. To start that discussion, let’s take a look at his xwOBA throughout the season.
When Cody wrote his article, Duran’s xwOBA was sitting at .237, on a league average of just over .300. Today, his xwOBA is sitting at .281. That’s still better than league average, but it’s not world-beating any longer. But why?
Looking at Statcast and Baseball Savant data, so far this season, Duran has had only one effective pitch - his splinker. Throughout ’24, that is still a consistently great pitch for him. However, his fastball and his curve have both been much worse than typical for him, and rank poorly overall.
So, what has changed since last season, aside from his velocity dip? Last year, each of his offerings were good, and his splinker was GREAT. Digging deeper, we can see that this year, his overall chase rate is down almost 4%, and his whiff rate is down 4.6%. His strikeout rate is 2.3% less than last year (but his walk rate is down slightly as well. Batters are hitting him less hard, but they are also elevating the ball more, as evidenced by his ground ball rate dropping 5.5%. Overall, his xBA is up almost 30 points year over year.
But why? Let’s look at his fastball and curveball separately. We will start either his fastball.,
Fastball
This year, Duran'is fastball has lost some vertical drop compared to the average fastball, so it’s likely that hitters are perceiving the pitch as more crushable.
Location has also been a factor for his fastball success. See his heat map for last year - a lot of pitches up, leading to a lot of swing and miss.
This year however, his fastball is generally going much lower, and it’s resulting in a roughly .800 xOPS - not what you want to see out of one of the best pitchers in baseball.
Curveball
We can see that his curveball used to be a putaway pitch, but now isn’t.
Here, we can see that his spin rate is down on his curveball, losing about 100 RPM since last year. His splinker and fastball have both lost a little spin as well, but its not drastic. We can also see that his extension is down slightly, so that likely accounts for some perceived velocity loss in addition to the actual loss.
His pitch location also may be impacting his results. See these comparisons:
Here we can see that last year, Duran threw a lot of curveballs that missed just low, leading to more whiffs. This year, his curves are tending to miss VERY low, which helps to explain his decrease in effectiveness. If a batter know’s it’s a ball, they won’t swing, and there’s a pretty good chance that with some of these locations, they just know.
Overall, the story this all tells is that Duran is a great pitcher who is struggling with some mechanics, and locating his pitches where they are most effective. Even when throwing a little slower, he still ranks near the 100% percentile in velocity. His stuff will play. Here’s to hoping that he and the coaching staff can get the mechanics and the command back on track.
What do you think? Are better days ahead for the flamethrower?
-
 Eric Blonigen got a reaction from h2oface for a blog entry, The guys the Twins drafted but didn't sign - a deep dive
We are now less than a month from the Rule-4 draft. National and local writers have started publishing deep-dives of mock drafts, player profiles, and general prognostication.
This article is not that. Instead, we will be doing a deep-dive into drafts past. The Twins, like any pro baseball team, have had their share of swings and misses in the draft. As fans, we feel great about guys like Royce Lewis, Brooks Lee, and Walker Jenkins. At the same time, we lament guys like Keoni Cavaco, Aaron Sabato, Tyler Jay, and more. Much ink has been spilled on all those guys right here on Twinsdaily. But how about the guys we drafted and DIDN’T sign? That’s what we are digging into today. I examined every draft class since the Twins moved from Washington in 1965, and looked at every player we didn’t sign. Then, I eliminated anyone who didn’t sign that accumulated less than 5 career bWAR.
I will be breaking unsigned draft picks into a few tiers:
What could have been? These guys could potentially have altered the franchise had they signed. Solid. These guys could have had roles on some good teams, and could have made some bad teams better. Just a guy. These players may have been fun or may have displaced someone who had no business on a Major League roster. Some had one good year, while others were role players for a long time. Notoriety. These guys may not have had a good or long career, but they went on to do something else in baseball that’s worth talking about. Spoiler: in both cases, they were involved in the Astros cheating scandal. Before we dig in, I do understand that EVERY team consistently attempts to sign HS players who are planning on going to College. Every team’s fans could build a list just like this one. However, what is baseball if not a chance to think about what could be? As a lifelong Twins fan, sometimes that dreaming is what keeps the fandom palatable. Read on for the deep dive!
Tier One - What could have been? These guys could have done a lot for the team, potentially altering the shape of the franchise, or leading to different outcomes some years.
George Springer - He was originally drafted by the Twins out of high school in the 48th round of the 2008 draft. Supposedly, Springer strongly considered signing with the Twins, but felt he wasn’t ready for pro baseball yet. He went to college, and was drafted by Houston in the 1st round of the 2011 draft. He finished 8th for AL ROY in 2014. He has won a Silver Slugger twice, in 2017 and 2019. He has received MVP votes in 2017, 2019, and 2020. Across his career, he has been 25% above league average as a hitter, has been worth 36.4 bWAR, and has a good shot to at least make it to the theoretical “Hall of Very Good”. His impact bat would have been felt in some of the late Terry Ryan years, and it would have made the Bomba Squad even better. He would have been a clear upgrade over guys like Eddie Rosario, Trevor Larnach, Nick Gordon, and Robbie Grossman.
J.D. Martinez - The Twins drafted Martinez in the 36th round of the 2006 draft. He didn’t sign, and the Astros drafted and signed him in 2009. Martinez has been worth 30.7 bWAR so far in his career even though he has been limited to COF and DH. He won the 2018 WS with the Red Sox. He has been a 3x Silver Slugger, in 2015 and 2018 (at two different positions). He has received MVP votes in three different seasons - 2015, 2018, 2019. He has also been a 6x All-star. Over his career, he has had an OPS+ of 132. Obviously, if the Twins would have signed (and kept) him, the opportunity cost would likely have been NOT signing other marquee players such as Nelson Cruz, Byron Buxton, or Carlos Correa. However, it’s fun to think about him manning LF or DH over the past several seasons.
J.J. Putz - The Twins drafted Putz in the 17th round of the 1998 draft. He eventually signed with Seattle in the 6th round of the 1999 draft. As a reliever, I hesitate to put him in this group. However, he was quite good for the majority of his career, and would have given a late-inning boost to a lot of Twins teams. He was an All-star in 2013, and received down-ballot MVP votes. He finished his career with a 138 ERA+, and was worth 13.1 bWAR as a relief pitcher. He would have looked really good in a Twins uniform alongside all-time great closers Joe Nathan and Glen Perkins, and he would have immediately supplanted guys like Jon Rauch and Matt Capps as closer, and would have eliminated the impact of the trades the Twins made to get them. He also could have helped some playoff Twins teams advance (or at least not get swept out).
Steve Garvey - He was drafted by the Twins in 1966, in the 3rd round. Two years later, the Dodgers drafted him in the 1st round and he signed. He played 19 seasons, 14 with the Dodgers, then 5 with the Padres. Over his career, he was a 10x All-star, a 4x Gold Glove winner, and 1974 MVP. He also received down ballot MVP votes 8 additional times, and won a World Series with the ’81 Dodgers. He also had 6 seasons with 200 or more hits, finishing his career with 2599.His peak was from 1974-1980. Who played the corner infield for the Twins? Guys like Ron Jackson and Mike Cubbage. I wasn’t alive for those teams, but it seems like a pretty clear upgrade.
Bret Boone - Remember Bret Boone? The Twins did eventually sign him in 2005, where he had 58 sub-replacement PAs and then was released and subsequently retired. But before that? He was very good for a very long time, accumulating 22.8 bWAR. The Twins drafted him way back in 1987, in the 28th round. Three years later, Seattle drafted him in the 5th and signed him. Bret was a 3x All-star, in 1998, 2001, and 2003. He also won Gold Glove 4 times, in 1998, 2001, 2002, and 2003 and Silver Slugger in 2001 and 2003. He received down ballot MPV votes in 1994, 2001, and 2003. Who manned second base during his peak? Chuck Knoblach for the first handful of years, who was great. After he was traded to NY, Luis Rivas took over and Boone would have been a clear upgrade.
Jason Varitek - Going back to 1993, the Twins drafted Varitek in the 1st round. A Boras client, he was advised to go back to college for his senior year in order to find a more favorable situation. Seattle drafted and signed him the following year, and he (eventually) went on to help the Red Sox break the curse of the Bambino. Over the course of his catching career, he was a 3x All-star, twice won the World Series, won a Gold Glove, a Silver Slugger, and was one of only four team captains in Red Sox history. He was worth 24 bWAR. In hindsight, even when thinking about a player of Varitek’s caliber, his catching career overlapped guys like Terry Steinbach, A.J. Pierzynski, and Joe Mauer. Somewhat strangely, his value very closely matched theirs year by year.
Tier Two - Solid. These guys were regulars, and would have been better options than some the Twins were fielding on a nightly basis.
Tim Belcher - Drafted by the Twins 1st overall in 1983, he failed to sign. Oof. He signed, again in the 1st round, a year later by the Yankees. The SP won a World Series with the ’88 Dodgers, and accumulated 26 bWAR, and would have beat out other middling pitchers like Mark Guthrie, Joe Niekro, Pat Mahomes, Freddie Tolivar, Carlos Pulido, and (starter) Eddie Guardado. He was involved in multiple altercations - once with a cameraman, once with Chan-Ho Park. He went on to become a special assistant to the Cleveland front office
Del Unser - The Twins 2nd round pick in 1965, he signed a year later with the (new) Washington Senators and went on to win a World Series with the Phillies in 1980. He accumulated 16.7 bWAR. At CF and 1B, he scattered three good seasons in the late ‘60s and early ‘70s, but was otherwise forgettable. He would likely have lost his starting job halfway through his career.
Kolten Wong - Drafted by the Twins in the 16th round in 2008, he signed after college, going in the first round to STL. He finished third in the 2014 AL ROY voting. Wong has been a 2x Gold Glove winner. The 2nd baseman has been worth 22 bWAR so far, and would have been a valuable player, but would have interfered with some combo of Brian Dozier, Trevor Plouffe, and Eduardo Escobar in his path to playing time.
Aaron Sele - Sele was drafted in ’88 in the 37th round, signing with the Red Sox after being drafted in the 1st round in ’91. He finished 3rd in AL RoY balloting in 1993, was a 2x AS in 1998 and 2000, and finished 5th for the AL Cy Young in 1999. Across a 15 year career, he was an exactly league average pitcher, although he was solidly above average for the first half of his career. He accumulated 20.1 bWAR and would have beaten out guys like Frankie Rodriguez, Mike Morgan, Mike Lincoln, and Sean Bergman. Remember any of them? Me neither. They were largely replacement level or worse as members of the Twins rotation.
Tyler Anderson - The Twins drafted Anderson in 2008 in the 50th round. Three years later, Colorado took him in the 1st. He made the 2022 All-star team with the Dodgers. He has amassed 15.3 bWAR so far, and pitched to a 106 ERA+. While not a frontline arm, Anderson would have prevented some innings from such luminaries as Matt Shoemaker.
Rick Burleson - He was drafted in the 8th round of the summer draft in 1970, then taken months later in the supplemental winter draft in the 1st round by Boston. As a shortstop, he finished 4th in the 1974 ROY balloting, received MVP votes in 4 different seasons, was a 4x All-star, and won the Silver Slugger in 1981. He also won a gold glove in 1979 at SS. In his career, he was worth 22.9 bWAR. He would have been clearly better than Ron Washington and Danny Thompson, but his career also intersected with Roy Smalley and Greg Gagne, so had he signed with the Twins, it might have been complicated, or he may have needed to shift positions.
Al Hrabosky - Drafted by the Twins in 1967 in the 11th round, and signing two years later in the 1st round with the Cardinals. Al went by the moniker “The Mad Hungarian” due to his eccentric pitching routines designed to intimidate batters. As a relief pitcher, Al received both down-ballot Cy Young and MVP votes in 1974 and 1975, during the latter of which he was the NL Saves leader. During his peak, the Twins fielded largely middling teams, so he would not have moved the needle. However, he would have added some fun. He has been a color commentator for the Cardinals since 1985.
Tier Three - Just guys. These guys typically had long major-league careers, but they weren’t necessarily better than other in house options. Might they have changed some outcomes? Sure.
Travis Lee - He was the 2nd overall pick of the ’96 draft, but failed to sign a contract within 15 days so he became a free agent. Arizona signed him to a 4/$10M deal. He was worth 7.3 bWAR.
Steve Pearce - Drafted in the 45th round of the 2003 draft, he signed with Boston in the 10th a year later. He had one All-Star caliber season in 2014, but was not an All-star that year. In 2018, he won a WS with Boston, and was the WS MVP. Overall, he was just a guy, worth 9.8 bWAR. His competition throughout his peak would have been guys like Mauer, Escobar, Rosario, and Dozier, all of whom were better.
Adam Lind - Drafted by the Twins in 2002 and signed by the Blue Jays in 2004, he was the 2009 Silver Slugger and Edgar Martinez award winner. He was worth 12.7 bWAR
Jerry Reed - This one is a rare case of a player failing to sign out of high school, then being drafted LOWER after college, dropping from the 11th round in 1973, to signing in the 22nd with the Phillies in 1977. He pitched in 238 major-league games, mostly in relief, and retired worth 5 bWAR.
Pete Falcone - He was a back-of-the-rotation SP who finished his career with a 91 ERA+, and retired worth 8.9 bWAR. Drafted by the Twins in 1972 and signed a year later by the Giants.
Yonder Alonso - Drafted in the 16th round in 2005, he went 7th overall in 2008 to the Reds. He finished 6th in the 2012 AL ROY voting. He was a 2017 AS with Oakland. He has hit as a 103 OPS+ player. Signing him wouldn’t have worked out, as he would have blocked Joe Mauer's transition to 1B, and Mauer was clearly better. He has been worth 8.1 bWAR.
Paul Maholm - Just a guy. He was a back-of-the-rotation SP who finished his career with a 95 ERA+, accumulating11.9 bWAR. After failing to sign in the 17th round in 2000, Pittsburgh signed him in 2003 in the 1st round
Brian Anderson - Drafted in the 20th round in 2011, and signed by Miami in the 3rd in 2014. He finished 4th in the 2018 AL ROY balloting He’s been a roughly league-average hitter, with a 101 OPS+ across his career so far, although he’s trending downwards. He has been worth 9.8 bWAR so far. If the Twins had signed him, it may have made the Josh Donaldson signing unnecessary, and he also could have filled Gio Urshela’s shoes.
Eric Show - Drafted by the Twins in 1974, he signed four years later by the Padres. While Eric holds the Padres’ record for most career wins, with 100, his career was up and down, with a slightly-below-average 99 ERA+, and was worth 15.6 bWAR. He was a solid #2 starter for a while, but went through some personal problems, and he died of a drug overdose at 37.
Gary Mathews Jr - Drafted in the 38th round in 1992, he signed in 1993 with the Padres after being drafted in the 13th round. He played 12 years in the majors, with below-average offense, but solid defense. He accumulated 14.2 bWAR, and was implicated in the Mitchell Report on steroid use in baseball. I guess if the Twins had signed him, he might have supplanted Terry Tiffee at the end of his career, but otherwise, was largely worse than the options the Twins had available to them.
Brian Lawrence - The Twins drafted him in 1994, in the 39th round. In 1998, the Padres signed him in the 17th round. He was a starting pitcher, with a 93 OPS+ over his career. Whatever.
Chase Anderson - The Twins drafted and failed to sign him TWICE, in 2006 and 2007. He had one good season in 2017, but otherwise, has generally been a back of the rotation arm with middling stuff. To date, he has accumulated 8.1 bWAR, and is still active. He might have prevented some desperation starts for guys like Matt Shoemaker, Chris Archer, JA Happ, Randy Dobnak, et al., but would not have moved the needle for us.
Jason Vargas - Miami signed him in 2004 after the Twins failed to a year earlier. He finished his career with a 93 OPS+. He pitched for a long time, but has been a back of the rotation guy most of the time. He might have prevented some starts for the same guys as Chase Anderson.
Tier Four - Notorious - these guys weren’t good players, but they are forever imprinted on baseball’s collective consciousness.
Alex Cora - Drafted by the Twins in the 1993 12th round and signed by the Dodgers in the 3rd of the 1996 draft, Alex was a marginal player as a catcher, worth 7 bWAR over his career. However, his career has transcended beyond just playing, and he has found success at multiple levels. He won the 2007 World Series with Boston as a player, and, won the 2017 World Series with Houston as bench coach, and ALSO won the 2018 World Series as the Manager of the Red Sox. As a Manager, he has a .540 winning percentage. He was involved in the 2019 trashcan scandal and was banned for a year.
A.J. Hinch - The Twins drafted him in 2003, and he signed a year later with Oakland. Both drafts, he was selected in the third round. Played for four teams across part of 7 years. While he was a replacement-level player across his career, he did achieve a place in baseball notoriety. He was the Manager for the 2019 Astros World Series-losing team who was later fired for his role in the trash can cheating scandal. He also led the 2017 Astros to a World Series victory, but I’ll put an asterisk on that.
So, what do you think? Any guys you are sad we couldn’t sign? Comment below!
-
Eric Blonigen got a reaction from h2oface for a blog entry, A deep dive into umpire accuracy and our standings
Every sports fan is likely to believe the umps are biased against their team, but there have been several games lately that make it seem like the fates are working against the Twins. Let's look at some examples.
In last night's game against the Pirates, assistant hitting coach Derek Shomon was ejected for arguing balls and strikes. As it turns out, he was right to be frustrated, as HP ump Paul Clemons called a pitch to Correa a strike when it was a ball. Later in the inning, with bases loaded, a ball to Kepler was called a strike, impacting the shape of the plate appearance, the inning, and the game, as the Twins were unable to score a run. After the game, the folks at umpirescorecards.com released their scorecard, and Pittsburgh was awarded 1.17 runs in their favor.
During the Yankees series, there were several questionable calls and most seemed to go against the Twins. That seems to be a trend on the season. Let's take a deeper dive into the data
So far this season, if all pitches had been called correctly, the Twins should have scored an additional 5.22 runs. Their main divisional opponent, the Guardians, should have scored 17.82 FEWER runs than they have. Overall, that 23 run differential means that the two teams should be much closer in the standings than they are. However, not all runs are created equal. So, I looked at the ump scorecards for each game that was decided by two of fewer runs to understand exactly what impact the umpires have had on the two teams results.
For starters, there have been two head-to-head games that went Cleveland's favor that actually should have been Twins victories. Here are the scorecards for the 4/6 and 5/17 games.
There have been other examples of Twins losses that the outcome should have been wins, or at least may have ended differently. On 4/14 against the Tigers, the final score was 3-4 Tigers, but they scored 1.32 additional runs due to ball and strike calls.
On 4/19, also against the Tigers, the 4-5 loss was in part decided by the extra .88 runs awarded to the Tigers.
That's four losses directly attributed to incorrect ball and strike calls.
There was also a single example of the Twins recording a win that they may not have earned. On 4/23, against the White Sox, the 6-5 score was aided by an extra run in our favor.
Net-net, this likely means we should have at least three more wins than we actually do.
Earlier, I mentioned Cleveland's 17.82 surplus runs. According to umpirescorecards.com, they lead all of baseball in favorable calls. How has this impacted their win total? In addition to the two-game swing based on the head-to-head matchups discussed earlier, they have had several one-run victories where they scored a half-run due to ball and strike calls. While these may still have ended in Cleveland wins, the outcome may have been different on 4/18, 5/6, 6/1, and 6/7.
Perhaps more importantly for Cleveland, they have only had a single game this season that calls went against them in a meaningful way - 4/13 against the Yankees. With a final score of 3-2 Yankees, the evil empire was granted an extra .55 runs.
.
Assuming that Cleveland would have won half those games anyway, it's fair to think their actual win total should be four wins less than reality.
What's the impact of all this? Well, entering play on 6/8/24, Cleveland is 40-22 and the Twins are 33-30. Based on expected win totals were balls and strikes called accurately and consistently, the ACTUAL win/loss records should be Cleveland at 36-26, and the Twins at...36-27. That reality would feel much different for fans than the one we are living. The good news is we are well-positioned the rest of the way, with one of the easiest remaining schedules in baseball. Cleveland has one of the hardest. With some fair umpires, we just might be able to run away with the division.
Thoughts?
-
 Eric Blonigen got a reaction from Eris for a blog entry, A deep dive into umpire accuracy and our standings
Every sports fan is likely to believe the umps are biased against their team, but there have been several games lately that make it seem like the fates are working against the Twins. Let's look at some examples.
In last night's game against the Pirates, assistant hitting coach Derek Shomon was ejected for arguing balls and strikes. As it turns out, he was right to be frustrated, as HP ump Paul Clemons called a pitch to Correa a strike when it was a ball. Later in the inning, with bases loaded, a ball to Kepler was called a strike, impacting the shape of the plate appearance, the inning, and the game, as the Twins were unable to score a run. After the game, the folks at umpirescorecards.com released their scorecard, and Pittsburgh was awarded 1.17 runs in their favor.
During the Yankees series, there were several questionable calls and most seemed to go against the Twins. That seems to be a trend on the season. Let's take a deeper dive into the data
So far this season, if all pitches had been called correctly, the Twins should have scored an additional 5.22 runs. Their main divisional opponent, the Guardians, should have scored 17.82 FEWER runs than they have. Overall, that 23 run differential means that the two teams should be much closer in the standings than they are. However, not all runs are created equal. So, I looked at the ump scorecards for each game that was decided by two of fewer runs to understand exactly what impact the umpires have had on the two teams results.
For starters, there have been two head-to-head games that went Cleveland's favor that actually should have been Twins victories. Here are the scorecards for the 4/6 and 5/17 games.
There have been other examples of Twins losses that the outcome should have been wins, or at least may have ended differently. On 4/14 against the Tigers, the final score was 3-4 Tigers, but they scored 1.32 additional runs due to ball and strike calls.
On 4/19, also against the Tigers, the 4-5 loss was in part decided by the extra .88 runs awarded to the Tigers.
That's four losses directly attributed to incorrect ball and strike calls.
There was also a single example of the Twins recording a win that they may not have earned. On 4/23, against the White Sox, the 6-5 score was aided by an extra run in our favor.
Net-net, this likely means we should have at least three more wins than we actually do.
Earlier, I mentioned Cleveland's 17.82 surplus runs. According to umpirescorecards.com, they lead all of baseball in favorable calls. How has this impacted their win total? In addition to the two-game swing based on the head-to-head matchups discussed earlier, they have had several one-run victories where they scored a half-run due to ball and strike calls. While these may still have ended in Cleveland wins, the outcome may have been different on 4/18, 5/6, 6/1, and 6/7.
Perhaps more importantly for Cleveland, they have only had a single game this season that calls went against them in a meaningful way - 4/13 against the Yankees. With a final score of 3-2 Yankees, the evil empire was granted an extra .55 runs.
.
Assuming that Cleveland would have won half those games anyway, it's fair to think their actual win total should be four wins less than reality.
What's the impact of all this? Well, entering play on 6/8/24, Cleveland is 40-22 and the Twins are 33-30. Based on expected win totals were balls and strikes called accurately and consistently, the ACTUAL win/loss records should be Cleveland at 36-26, and the Twins at...36-27. That reality would feel much different for fans than the one we are living. The good news is we are well-positioned the rest of the way, with one of the easiest remaining schedules in baseball. Cleveland has one of the hardest. With some fair umpires, we just might be able to run away with the division.
Thoughts?
-
 Eric Blonigen got a reaction from adjacent for a blog entry, A deep dive into umpire accuracy and our standings
Every sports fan is likely to believe the umps are biased against their team, but there have been several games lately that make it seem like the fates are working against the Twins. Let's look at some examples.
In last night's game against the Pirates, assistant hitting coach Derek Shomon was ejected for arguing balls and strikes. As it turns out, he was right to be frustrated, as HP ump Paul Clemons called a pitch to Correa a strike when it was a ball. Later in the inning, with bases loaded, a ball to Kepler was called a strike, impacting the shape of the plate appearance, the inning, and the game, as the Twins were unable to score a run. After the game, the folks at umpirescorecards.com released their scorecard, and Pittsburgh was awarded 1.17 runs in their favor.
During the Yankees series, there were several questionable calls and most seemed to go against the Twins. That seems to be a trend on the season. Let's take a deeper dive into the data
So far this season, if all pitches had been called correctly, the Twins should have scored an additional 5.22 runs. Their main divisional opponent, the Guardians, should have scored 17.82 FEWER runs than they have. Overall, that 23 run differential means that the two teams should be much closer in the standings than they are. However, not all runs are created equal. So, I looked at the ump scorecards for each game that was decided by two of fewer runs to understand exactly what impact the umpires have had on the two teams results.
For starters, there have been two head-to-head games that went Cleveland's favor that actually should have been Twins victories. Here are the scorecards for the 4/6 and 5/17 games.
There have been other examples of Twins losses that the outcome should have been wins, or at least may have ended differently. On 4/14 against the Tigers, the final score was 3-4 Tigers, but they scored 1.32 additional runs due to ball and strike calls.
On 4/19, also against the Tigers, the 4-5 loss was in part decided by the extra .88 runs awarded to the Tigers.
That's four losses directly attributed to incorrect ball and strike calls.
There was also a single example of the Twins recording a win that they may not have earned. On 4/23, against the White Sox, the 6-5 score was aided by an extra run in our favor.
Net-net, this likely means we should have at least three more wins than we actually do.
Earlier, I mentioned Cleveland's 17.82 surplus runs. According to umpirescorecards.com, they lead all of baseball in favorable calls. How has this impacted their win total? In addition to the two-game swing based on the head-to-head matchups discussed earlier, they have had several one-run victories where they scored a half-run due to ball and strike calls. While these may still have ended in Cleveland wins, the outcome may have been different on 4/18, 5/6, 6/1, and 6/7.
Perhaps more importantly for Cleveland, they have only had a single game this season that calls went against them in a meaningful way - 4/13 against the Yankees. With a final score of 3-2 Yankees, the evil empire was granted an extra .55 runs.
.
Assuming that Cleveland would have won half those games anyway, it's fair to think their actual win total should be four wins less than reality.
What's the impact of all this? Well, entering play on 6/8/24, Cleveland is 40-22 and the Twins are 33-30. Based on expected win totals were balls and strikes called accurately and consistently, the ACTUAL win/loss records should be Cleveland at 36-26, and the Twins at...36-27. That reality would feel much different for fans than the one we are living. The good news is we are well-positioned the rest of the way, with one of the easiest remaining schedules in baseball. Cleveland has one of the hardest. With some fair umpires, we just might be able to run away with the division.
Thoughts?
-
 Eric Blonigen got a reaction from Strombomb for a blog entry, A deep dive into umpire accuracy and our standings
Every sports fan is likely to believe the umps are biased against their team, but there have been several games lately that make it seem like the fates are working against the Twins. Let's look at some examples.
In last night's game against the Pirates, assistant hitting coach Derek Shomon was ejected for arguing balls and strikes. As it turns out, he was right to be frustrated, as HP ump Paul Clemons called a pitch to Correa a strike when it was a ball. Later in the inning, with bases loaded, a ball to Kepler was called a strike, impacting the shape of the plate appearance, the inning, and the game, as the Twins were unable to score a run. After the game, the folks at umpirescorecards.com released their scorecard, and Pittsburgh was awarded 1.17 runs in their favor.
During the Yankees series, there were several questionable calls and most seemed to go against the Twins. That seems to be a trend on the season. Let's take a deeper dive into the data
So far this season, if all pitches had been called correctly, the Twins should have scored an additional 5.22 runs. Their main divisional opponent, the Guardians, should have scored 17.82 FEWER runs than they have. Overall, that 23 run differential means that the two teams should be much closer in the standings than they are. However, not all runs are created equal. So, I looked at the ump scorecards for each game that was decided by two of fewer runs to understand exactly what impact the umpires have had on the two teams results.
For starters, there have been two head-to-head games that went Cleveland's favor that actually should have been Twins victories. Here are the scorecards for the 4/6 and 5/17 games.
There have been other examples of Twins losses that the outcome should have been wins, or at least may have ended differently. On 4/14 against the Tigers, the final score was 3-4 Tigers, but they scored 1.32 additional runs due to ball and strike calls.
On 4/19, also against the Tigers, the 4-5 loss was in part decided by the extra .88 runs awarded to the Tigers.
That's four losses directly attributed to incorrect ball and strike calls.
There was also a single example of the Twins recording a win that they may not have earned. On 4/23, against the White Sox, the 6-5 score was aided by an extra run in our favor.
Net-net, this likely means we should have at least three more wins than we actually do.
Earlier, I mentioned Cleveland's 17.82 surplus runs. According to umpirescorecards.com, they lead all of baseball in favorable calls. How has this impacted their win total? In addition to the two-game swing based on the head-to-head matchups discussed earlier, they have had several one-run victories where they scored a half-run due to ball and strike calls. While these may still have ended in Cleveland wins, the outcome may have been different on 4/18, 5/6, 6/1, and 6/7.
Perhaps more importantly for Cleveland, they have only had a single game this season that calls went against them in a meaningful way - 4/13 against the Yankees. With a final score of 3-2 Yankees, the evil empire was granted an extra .55 runs.
.
Assuming that Cleveland would have won half those games anyway, it's fair to think their actual win total should be four wins less than reality.
What's the impact of all this? Well, entering play on 6/8/24, Cleveland is 40-22 and the Twins are 33-30. Based on expected win totals were balls and strikes called accurately and consistently, the ACTUAL win/loss records should be Cleveland at 36-26, and the Twins at...36-27. That reality would feel much different for fans than the one we are living. The good news is we are well-positioned the rest of the way, with one of the easiest remaining schedules in baseball. Cleveland has one of the hardest. With some fair umpires, we just might be able to run away with the division.
Thoughts?
-
 Eric Blonigen got a reaction from Doctor Gast for a blog entry, A deep dive into umpire accuracy and our standings
Every sports fan is likely to believe the umps are biased against their team, but there have been several games lately that make it seem like the fates are working against the Twins. Let's look at some examples.
In last night's game against the Pirates, assistant hitting coach Derek Shomon was ejected for arguing balls and strikes. As it turns out, he was right to be frustrated, as HP ump Paul Clemons called a pitch to Correa a strike when it was a ball. Later in the inning, with bases loaded, a ball to Kepler was called a strike, impacting the shape of the plate appearance, the inning, and the game, as the Twins were unable to score a run. After the game, the folks at umpirescorecards.com released their scorecard, and Pittsburgh was awarded 1.17 runs in their favor.
During the Yankees series, there were several questionable calls and most seemed to go against the Twins. That seems to be a trend on the season. Let's take a deeper dive into the data
So far this season, if all pitches had been called correctly, the Twins should have scored an additional 5.22 runs. Their main divisional opponent, the Guardians, should have scored 17.82 FEWER runs than they have. Overall, that 23 run differential means that the two teams should be much closer in the standings than they are. However, not all runs are created equal. So, I looked at the ump scorecards for each game that was decided by two of fewer runs to understand exactly what impact the umpires have had on the two teams results.
For starters, there have been two head-to-head games that went Cleveland's favor that actually should have been Twins victories. Here are the scorecards for the 4/6 and 5/17 games.
There have been other examples of Twins losses that the outcome should have been wins, or at least may have ended differently. On 4/14 against the Tigers, the final score was 3-4 Tigers, but they scored 1.32 additional runs due to ball and strike calls.
On 4/19, also against the Tigers, the 4-5 loss was in part decided by the extra .88 runs awarded to the Tigers.
That's four losses directly attributed to incorrect ball and strike calls.
There was also a single example of the Twins recording a win that they may not have earned. On 4/23, against the White Sox, the 6-5 score was aided by an extra run in our favor.
Net-net, this likely means we should have at least three more wins than we actually do.
Earlier, I mentioned Cleveland's 17.82 surplus runs. According to umpirescorecards.com, they lead all of baseball in favorable calls. How has this impacted their win total? In addition to the two-game swing based on the head-to-head matchups discussed earlier, they have had several one-run victories where they scored a half-run due to ball and strike calls. While these may still have ended in Cleveland wins, the outcome may have been different on 4/18, 5/6, 6/1, and 6/7.
Perhaps more importantly for Cleveland, they have only had a single game this season that calls went against them in a meaningful way - 4/13 against the Yankees. With a final score of 3-2 Yankees, the evil empire was granted an extra .55 runs.
.
Assuming that Cleveland would have won half those games anyway, it's fair to think their actual win total should be four wins less than reality.
What's the impact of all this? Well, entering play on 6/8/24, Cleveland is 40-22 and the Twins are 33-30. Based on expected win totals were balls and strikes called accurately and consistently, the ACTUAL win/loss records should be Cleveland at 36-26, and the Twins at...36-27. That reality would feel much different for fans than the one we are living. The good news is we are well-positioned the rest of the way, with one of the easiest remaining schedules in baseball. Cleveland has one of the hardest. With some fair umpires, we just might be able to run away with the division.
Thoughts?


