Parker Hageman
-
Posts
4,137 -
Joined
-
Last visited
-
Days Won
6
Content Type
Profiles
News
Minnesota Twins Videos
2026 Minnesota Twins Top Prospects Ranking
2022 Minnesota Twins Draft Picks
Minnesota Twins Free Agent & Trade Rumors, Notes, & Tidbits
Guides & Resources
2023 Minnesota Twins Draft Picks
The Minnesota Twins Players Project
2024 Minnesota Twins Draft Picks
2025 Minnesota Twins Draft Pick Tracker
2026 Minnesota Twins Draft Pick Tracker
Forums
Blogs
Events
Store
Downloads
Gallery
Everything posted by Parker Hageman
-

Caleb Thielbar's Secret Weapon (Free Preview)
Parker Hageman replied to Parker Hageman's topic in Twins Daily Front Page News
The interesting thing about Thielbar's curveball is that during his pitch design process while out of the Twins system, he tried to design it to mirror Kershaw's breaking ball -- and got pretty close! Thielbar actually matched the movement closely. In 2020, it had more inches of break but was thrown above 5 mph slower on average. Over the next two seasons, Thielbar added more horizontal movement (sweep) to the pitch. That's a big component of the Twins' pitching department -- getting horizontal movement on breaking pitches. They like late movement -- sliders, cutters -- and want more sweep with most of their curves now. This past year the two left-handed pitchers shared the same average velo (73.0 for Thielbar, 73.2 for Kershaw) but now Thielbar's curve moves more horizontally (10.5 inches of break for Thielbar, 4.9 for Kershaw). Is it better? For Thielbar, the performance on that pitch has actually gotten worse. It's possible that the new shape has helped the fastball or slider. -
 If things had gone differently, Caleb Thielbar might have been in South Dakota, conducting recruiting visits and game-planning for a Division II baseball program as Augustana’s pitching coach. If he didn’t seek help from Driveline Baseball, he might not have added the necessary velocity or maximized each pitch’s effectiveness. If he did not get invited onto USA Baseball’s Premier 12 roster in 2019 – one composed of mostly young prospects – he might not have caught the attention of scouts with his high spin curveball and his now low 90s fastball. Instead, he’s reporting alongside the other pitchers and catchers in Fort Myers next month, returning to the Minnesota Twins as one of the most valuable weapons in the bullpen. Thielbar’s age-35 season was pretty impressive. He struck out 32.7% of hitters faced (20th best among pitchers who faced 200 or more batters). He allowed the lowest hard-hit ball percentages (25.9%) than anyone not named Lucas Luetge. What is unique about Thielbar is that as he ages, his velocity increases – the rare Benjamin Button effect for pitchers. When pitchers increase velocity, they discuss expanding the ceiling and the floor. Thielbar was capable of reaching 92.8 in 2020 but sat at 89.8. The following season, he was topping at 95.3 while sitting at 91.3. This past season, while the ceiling didn’t move much (he maxed at 95.5), his average fastball velocity was now at 92.8. Moreover, Thielbar’s secondary pitches also saw a good amount of velocity spike. In 2020, his curve averaged 68.7 but was up to 73.0 mph in 2022. The slider averaged 77.5 in 2020 and was now up to 81.3. Thielbar had a well-documented transformation at Driveline. Their pitching experts found minor issues with his mechanics overall. But they did find one area for him to attack in his remote training. Plyo drills, prescribed thanks to Driveline’s biomechanics analysis that revealed he had lower than usual hip-shoulder separation at foot plant, helped him improve this area of his mechanics and aided some of his velocity gains. He also acknowledged that he was trying to throw harder, as crazy as that sounds. When you compare the 2020 mechanics to this past year’s, you can visually see someone who indeed appears to be trying to throw harder. Still, Thielbar’s velocity improvement remained below average for major league left-handed relievers. Despite the gains, Thielbar’s fastball was at the 39th percentile for velocity in 2022. Nevertheless, at a 17.9% swinging strike rate, his fastball missed more bats than every reliever besides Pittsburgh’s David Bednar (who threw his at a slightly crisper 96.5 mph on average)*. So how was it so effective? Well that requires a deeper dive, available only to Twins Daily's Caretakers. Our Caretakers take care of the site and in return, we take care of them. That includes us investing in deeper dive stories, like this story, and others by Parker Hageman, Matthew Trueblood and others. Caretakers also get free Winter Meltdown tickets, acknowledgement in the forums, and other perks. If you visit Twins Daily, well, daily, maybe it's time to consider joining our Caretakers. We would love to have you join our little club, and we think you'll love it, too, and not just for the perks. Just click here to get started.
 -
 If things had gone differently, Caleb Thielbar might have been in South Dakota, conducting recruiting visits and game-planning for a Division II baseball program as Augustana’s pitching coach. If he didn’t seek help from Driveline Baseball, he might not have added the necessary velocity or maximized each pitch’s effectiveness. If he did not get invited onto USA Baseball’s Premier 12 roster in 2019 – one composed of mostly young prospects – he might not have caught the attention of scouts with his high spin curveball and his now low 90s fastball. Instead, he’s reporting alongside the other pitchers and catchers in Fort Myers next month, returning to the Minnesota Twins as one of the most valuable weapons in the bullpen. Thielbar’s age-35 season was pretty impressive. He struck out 32.7% of hitters faced (20th best among pitchers who faced 200 or more batters). He allowed the lowest hard-hit ball percentages (25.9%) than anyone not named Lucas Luetge. What is unique about Thielbar is that as he ages, his velocity increases – the rare Benjamin Button effect for pitchers. When pitchers increase velocity, they discuss expanding the ceiling and the floor. Thielbar was capable of reaching 92.8 in 2020 but sat at 89.8. The following season, he was topping at 95.3 while sitting at 91.3. This past season, while the ceiling didn’t move much (he maxed at 95.5), his average fastball velocity was now at 92.8. Moreover, Thielbar’s secondary pitches also saw a good amount of velocity spike. In 2020, his curve averaged 68.7 but was up to 73.0 mph in 2022. The slider averaged 77.5 in 2020 and was now up to 81.3. Thielbar had a well-documented transformation at Driveline. Their pitching experts found minor issues with his mechanics overall. But they did find one area for him to attack in his remote training. Plyo drills, prescribed thanks to Driveline’s biomechanics analysis that revealed he had lower than usual hip-shoulder separation at foot plant, helped him improve this area of his mechanics and aided some of his velocity gains. He also acknowledged that he was trying to throw harder, as crazy as that sounds. When you compare the 2020 mechanics to this past year’s, you can visually see someone who indeed appears to be trying to throw harder. Still, Thielbar’s velocity improvement remained below average for major league left-handed relievers. Despite the gains, Thielbar’s fastball was at the 39th percentile for velocity in 2022. Nevertheless, at a 17.9% swinging strike rate, his fastball missed more bats than every reliever besides Pittsburgh’s David Bednar (who threw his at a slightly crisper 96.5 mph on average)*. So how was it so effective? Thielbar began to throw the fastball almost exclusively up in the strike zone. In 2021, when he threw fastballs in the upper half of the zone at a 57.6% rate, he had an 18.6% swinging strike rate (compared to a 5.2% one in the lower half of the zone). He went all in on upstairs in 2022 — 72.6% of fastballs thrown were in the upper half of the zone. Thielbar also said in July 2020 that he was trying to make his fastball spin as efficiently as possible. What Thielbar was trying to do was backspin the ball as close to north and south as possible. Thielbar achieved this by slightly altering his release to stay behind the ball more. According to Baseball Savant, in 2020, he owned an active spin rate percentage of 89% (100% being a perfect backspinning fastball). In 2021 that rate jumped to 91% and then 92% last season. Consider these pitch release charts below. You need to know that the 0 line is north and south over the pitcher’s rubber. In 2020, his release was slightly over toward the first base side of the mound (13.9 inches), but he started to get that tighter back toward the center (6.4 inches in 2021). This past year that release point was nearly in line at 0 (4.1 inches). The average horizontal release point for left-handed pitchers is 25.0 inches. At 4.1 inches, Thielbar is a significant outlier. The only left-handed pitcher with a release point further to the right than Thielbar is his potential teammate, Danny Coulombe (who is at -4.3 inches and an extreme example in this category). The key is to give hitters different looks. Why does this matter for Thielbar? Typically, the more a pitcher’s release goes away from the center, the higher probability that it will have a different axis that will impart side spin and detract from the optimal backspin he is seeking. By being behind the ball more, he reduces the amount of cut or run on a pitch and optimizes the carry. The fastball fell less this year than in his previous seasons—hence the ability to be so effective up in the zone. Essentially, Thielbar became more consistent and efficient in throwing his fastball. He could effectively locate the pitch in the upper third of the zone. The elevated fastball improves the quality of the secondary pitches that can tunnel out of that. Look at the performance of his breaking balls (slider and curveball) playing off an elevated fastball: Caleb Thielbar | Breaking Balls Following Elevated Fastballs Batters Faced Swing% Chase% Swinging Strike% 2022 47 57.5 40.0 18.1 2021 32 43.2 25.4 8.8 By staying consistent with his fastball up in the zone, Thielbar would coax hitters to chase after his breaking stuff and, often, miss or make weak contact. Crafty is a word thrown around to describe what is often an aging left-handed pitcher who relies more on contorting the ball rather than blowing it past hitters. Thanks to technology and an advanced understanding of biomechanics, the lefty has not just prolonged his career but also thrived and dominated. In a different era, that might have been Thielbar’s destiny. That said, it’s hard to say when the ride will end. Thielbar has pushed his velocity north each year, and it’s rare to see a pitcher continue to do so well into their thirties (after all, time is undefeated in reducing a pitcher’s radar readings). In many ways, Thielbar is a crafty lefty. The word means being clever at achieving one’s aims. Through his acquisition of knowledge from Driveline and the Twins’ player development system, he has turned himself into a high-caliber relief arm. Caleb Thielbar is one crafty mother. *Among relievers who threw 400 or more fastballs in 2022.
 -
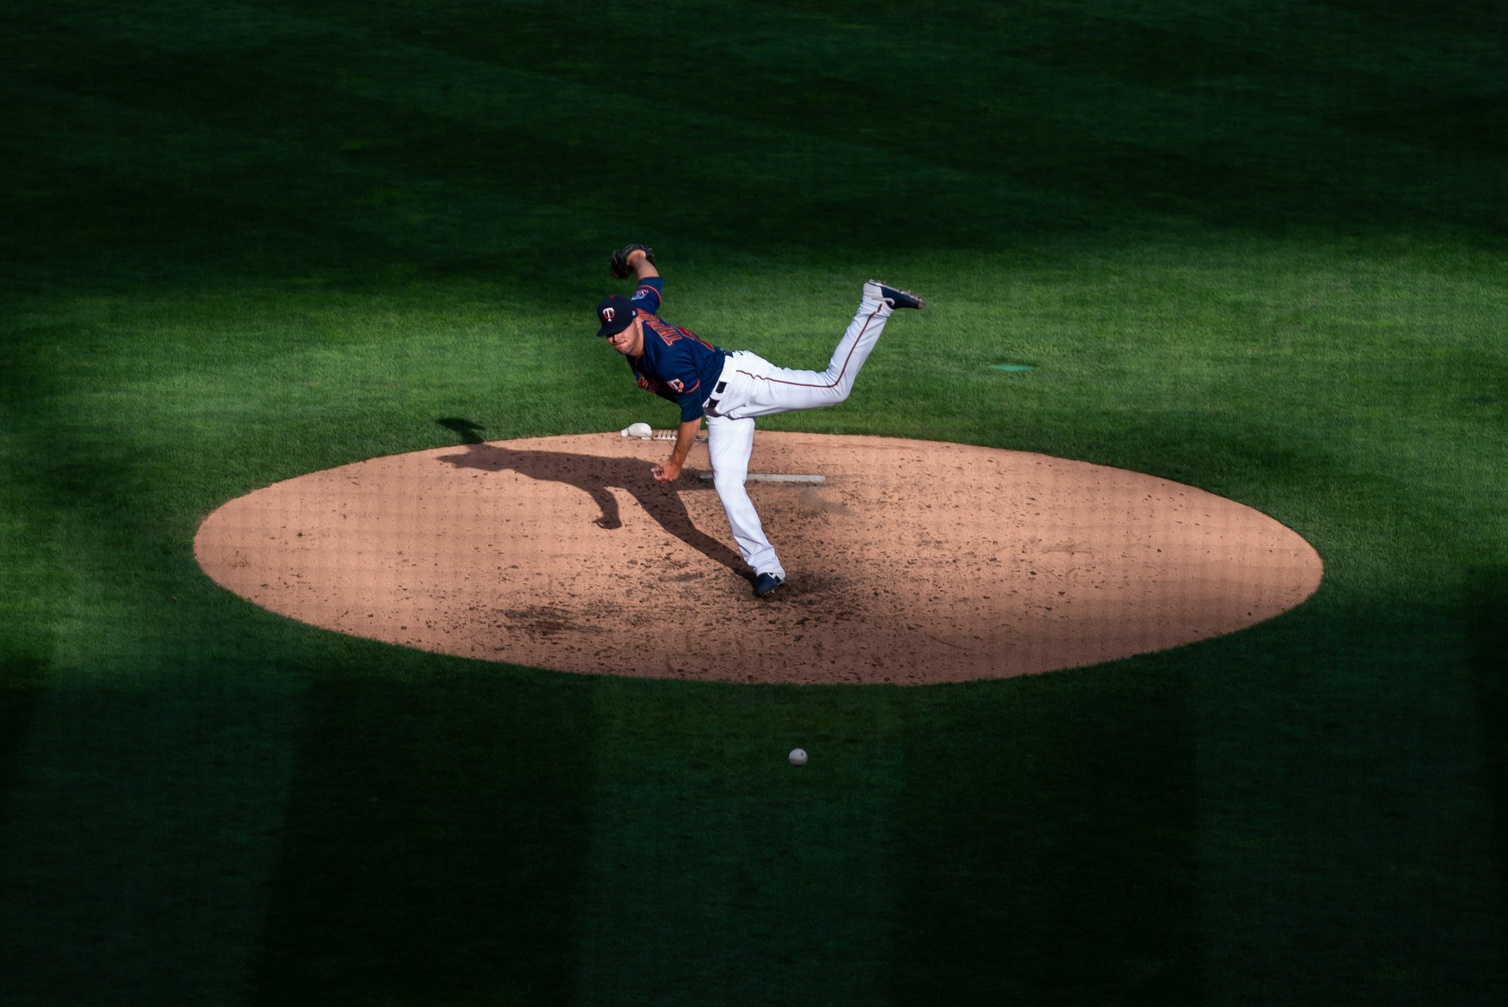
You know about the increased velocity, but it's how he's using it that has turned him into an elite left-handed reliever. Image courtesy of © Brad Rempel-USA TODAY Sports If things had gone differently, Caleb Thielbar might have been in South Dakota, conducting recruiting visits and game-planning for a Division II baseball program as Augustana’s pitching coach. If he didn’t seek help from Driveline Baseball, he might not have added the necessary velocity or maximized each pitch’s effectiveness. If he did not get invited onto USA Baseball’s Premier 12 roster in 2019 – one composed of mostly young prospects – he might not have caught the attention of scouts with his high spin curveball and his now low 90s fastball. Instead, he’s reporting alongside the other pitchers and catchers in Fort Myers next month, returning to the Minnesota Twins as one of the most valuable weapons in the bullpen. Thielbar’s age-35 season was pretty impressive. He struck out 32.7% of hitters faced (20th best among pitchers who faced 200 or more batters). He allowed the lowest hard-hit ball percentages (25.9%) than anyone not named Lucas Luetge. What is unique about Thielbar is that as he ages, his velocity increases – the rare Benjamin Button effect for pitchers. When pitchers increase velocity, they discuss expanding the ceiling and the floor. Thielbar was capable of reaching 92.8 in 2020 but sat at 89.8. The following season, he was topping at 95.3 while sitting at 91.3. This past season, while the ceiling didn’t move much (he maxed at 95.5), his average fastball velocity was now at 92.8. Moreover, Thielbar’s secondary pitches also saw a good amount of velocity spike. In 2020, his curve averaged 68.7 but was up to 73.0 mph in 2022. The slider averaged 77.5 in 2020 and was now up to 81.3. Thielbar had a well-documented transformation at Driveline. Their pitching experts found minor issues with his mechanics overall. But they did find one area for him to attack in his remote training. Plyo drills, prescribed thanks to Driveline’s biomechanics analysis that revealed he had lower than usual hip-shoulder separation at foot plant, helped him improve this area of his mechanics and aided some of his velocity gains. He also acknowledged that he was trying to throw harder, as crazy as that sounds. When you compare the 2020 mechanics to this past year’s, you can visually see someone who indeed appears to be trying to throw harder. Still, Thielbar’s velocity improvement remained below average for major league left-handed relievers. Despite the gains, Thielbar’s fastball was at the 39th percentile for velocity in 2022. Nevertheless, at a 17.9% swinging strike rate, his fastball missed more bats than every reliever besides Pittsburgh’s David Bednar (who threw his at a slightly crisper 96.5 mph on average)*. So how was it so effective? Well that requires a deeper dive, available only to Twins Daily's Caretakers. Our Caretakers take care of the site and in return, we take care of them. That includes us investing in deeper dive stories, like this story, and others by Parker Hageman, Matthew Trueblood and others. Caretakers also get free Winter Meltdown tickets, acknowledgement in the forums, and other perks. If you visit Twins Daily, well, daily, maybe it's time to consider joining our Caretakers. We would love to have you join our little club, and we think you'll love it, too, and not just for the perks. Just click here to get started. View full article
-
You know about the increased velocity, but it's how he's using it that has turned him into an elite left-handed reliever. Image courtesy of © Brad Rempel-USA TODAY Sports If things had gone differently, Caleb Thielbar might have been in South Dakota, conducting recruiting visits and game-planning for a Division II baseball program as Augustana’s pitching coach. If he didn’t seek help from Driveline Baseball, he might not have added the necessary velocity or maximized each pitch’s effectiveness. If he did not get invited onto USA Baseball’s Premier 12 roster in 2019 – one composed of mostly young prospects – he might not have caught the attention of scouts with his high spin curveball and his now low 90s fastball. Instead, he’s reporting alongside the other pitchers and catchers in Fort Myers next month, returning to the Minnesota Twins as one of the most valuable weapons in the bullpen. Thielbar’s age-35 season was pretty impressive. He struck out 32.7% of hitters faced (20th best among pitchers who faced 200 or more batters). He allowed the lowest hard-hit ball percentages (25.9%) than anyone not named Lucas Luetge. What is unique about Thielbar is that as he ages, his velocity increases – the rare Benjamin Button effect for pitchers. When pitchers increase velocity, they discuss expanding the ceiling and the floor. Thielbar was capable of reaching 92.8 in 2020 but sat at 89.8. The following season, he was topping at 95.3 while sitting at 91.3. This past season, while the ceiling didn’t move much (he maxed at 95.5), his average fastball velocity was now at 92.8. Moreover, Thielbar’s secondary pitches also saw a good amount of velocity spike. In 2020, his curve averaged 68.7 but was up to 73.0 mph in 2022. The slider averaged 77.5 in 2020 and was now up to 81.3. Thielbar had a well-documented transformation at Driveline. Their pitching experts found minor issues with his mechanics overall. But they did find one area for him to attack in his remote training. Plyo drills, prescribed thanks to Driveline’s biomechanics analysis that revealed he had lower than usual hip-shoulder separation at foot plant, helped him improve this area of his mechanics and aided some of his velocity gains. He also acknowledged that he was trying to throw harder, as crazy as that sounds. When you compare the 2020 mechanics to this past year’s, you can visually see someone who indeed appears to be trying to throw harder. Still, Thielbar’s velocity improvement remained below average for major league left-handed relievers. Despite the gains, Thielbar’s fastball was at the 39th percentile for velocity in 2022. Nevertheless, at a 17.9% swinging strike rate, his fastball missed more bats than every reliever besides Pittsburgh’s David Bednar (who threw his at a slightly crisper 96.5 mph on average)*. So how was it so effective? Thielbar began to throw the fastball almost exclusively up in the strike zone. In 2021, when he threw fastballs in the upper half of the zone at a 57.6% rate, he had an 18.6% swinging strike rate (compared to a 5.2% one in the lower half of the zone). He went all in on upstairs in 2022 — 72.6% of fastballs thrown were in the upper half of the zone. Thielbar also said in July 2020 that he was trying to make his fastball spin as efficiently as possible. What Thielbar was trying to do was backspin the ball as close to north and south as possible. Thielbar achieved this by slightly altering his release to stay behind the ball more. According to Baseball Savant, in 2020, he owned an active spin rate percentage of 89% (100% being a perfect backspinning fastball). In 2021 that rate jumped to 91% and then 92% last season. Consider these pitch release charts below. You need to know that the 0 line is north and south over the pitcher’s rubber. In 2020, his release was slightly over toward the first base side of the mound (13.9 inches), but he started to get that tighter back toward the center (6.4 inches in 2021). This past year that release point was nearly in line at 0 (4.1 inches). The average horizontal release point for left-handed pitchers is 25.0 inches. At 4.1 inches, Thielbar is a significant outlier. The only left-handed pitcher with a release point further to the right than Thielbar is his potential teammate, Danny Coulombe (who is at -4.3 inches and an extreme example in this category). The key is to give hitters different looks. Why does this matter for Thielbar? Typically, the more a pitcher’s release goes away from the center, the higher probability that it will have a different axis that will impart side spin and detract from the optimal backspin he is seeking. By being behind the ball more, he reduces the amount of cut or run on a pitch and optimizes the carry. The fastball fell less this year than in his previous seasons—hence the ability to be so effective up in the zone. Essentially, Thielbar became more consistent and efficient in throwing his fastball. He could effectively locate the pitch in the upper third of the zone. The elevated fastball improves the quality of the secondary pitches that can tunnel out of that. Look at the performance of his breaking balls (slider and curveball) playing off an elevated fastball: Caleb Thielbar | Breaking Balls Following Elevated Fastballs Batters Faced Swing% Chase% Swinging Strike% 2022 47 57.5 40.0 18.1 2021 32 43.2 25.4 8.8 By staying consistent with his fastball up in the zone, Thielbar would coax hitters to chase after his breaking stuff and, often, miss or make weak contact. Crafty is a word thrown around to describe what is often an aging left-handed pitcher who relies more on contorting the ball rather than blowing it past hitters. Thanks to technology and an advanced understanding of biomechanics, the lefty has not just prolonged his career but also thrived and dominated. In a different era, that might have been Thielbar’s destiny. That said, it’s hard to say when the ride will end. Thielbar has pushed his velocity north each year, and it’s rare to see a pitcher continue to do so well into their thirties (after all, time is undefeated in reducing a pitcher’s radar readings). In many ways, Thielbar is a crafty lefty. The word means being clever at achieving one’s aims. Through his acquisition of knowledge from Driveline and the Twins’ player development system, he has turned himself into a high-caliber relief arm. Caleb Thielbar is one crafty mother. *Among relievers who threw 400 or more fastballs in 2022. View full article
-
Great write-up. I don't think the Twins have fully punted on the idea of stealing bases across the organization. After all, three of their affiliates are in the top 5 of stolen bases in their respective leagues. And they have made a point of trying to train it better in camp. I definitely agree that the front office has done the analysis and decided the risk/reward is too great to utilize things like Buxton's speed in those circumstances. But Buxton is, both from a stylistic standpoint and a straight-line speed standpoint, an elite runner. There's no question that they'll developed major league rosters that are geared for power over speed. There's no doubt that they don't want to lose runners on the bases. Again, great write-up.
-
I think this is a valid point and always something to consider when looking at relievers in their small sample sizes. But, his performance against almost all teams in the second half had worse metrics (more walks, fewer strikeouts) and you cannot ignore the differences in approach and pitch design between his Baltimore stint and his Twins stint. There was something deliberate about that.
-
@jdgoin one of the more significant losses in this regard was jeremy hefner. there were multiple players and front office people that said he was the best bridge between the data/analytics/biomechanics side and the players. some even said more so than wes.
-
If that were true, this would be the entire article. I'll tell you what, sign up and read the entire post. It's $6 -- one domestic beer at an expensive joint. If you don't feel like you got anything out of it, I'll have @Brock Beauchamp refund you the Caretaker fee. If you do enjoy it, come back here and let us know. And you can read a couple more of the Caretaker posts before the end of the month,
-
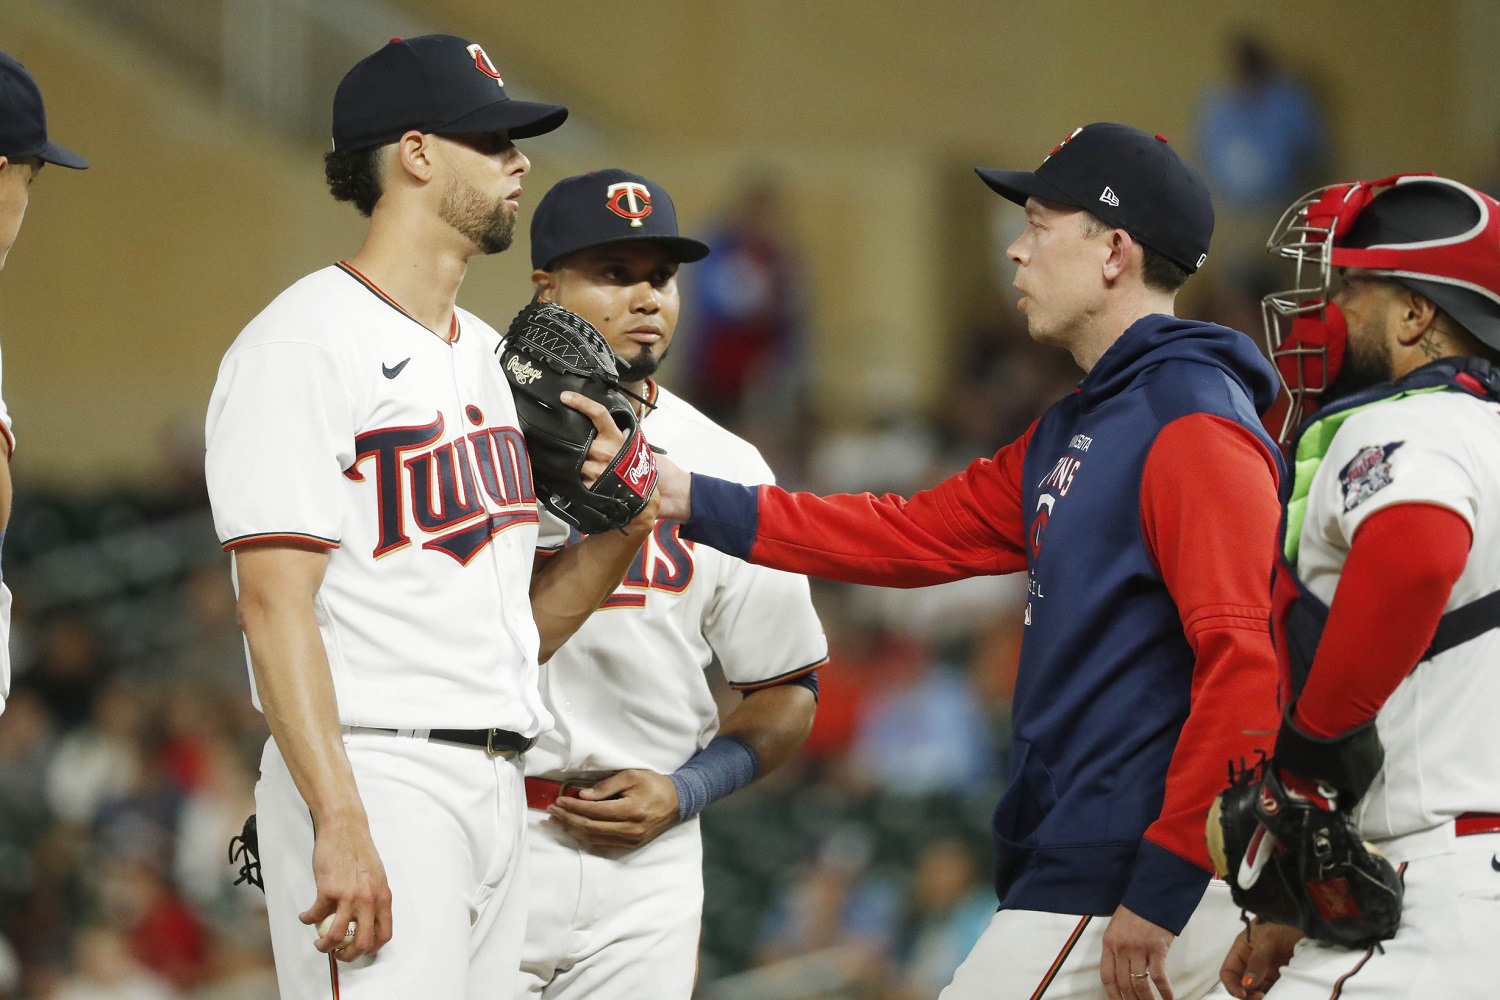
Jorge López's half-season with the Twins has people wondering if the team was hustled like some easy-mark Stanford grad on a Sicilian vacation. Image courtesy of © Bruce Kluckhohn-USA TODAY Sports With the Orioles, Jorge López was a dominant backend of the bullpen arm, outfitted with an upper 90s sinker and wiffleball movement at the top of the zone. He had some intriguing offspeed stuff, was missing bats, and locking down games. The Twins may have thought they could take a pitcher right near the cusp of being elite and make him that much better. However, that initial experiment has backfired. What happened? Pick any stat you want from López and it was likely substantially worse with the Twins. Strikeouts? Down — from 28% with Baltimore to 16% with the Twins. Walk rate? Up — from 9% to 15%. Batting average allowed? Up — it was a clean 174 with Baltimore and grew to a grotesque 314 with the Twins. Hard hit balls? Up — exit velocity of balls over 95 mph went from 30% to 44%. Star Tribune columnist Patrick Reusse tweeted on September 20 that López "was tremendous and always had excellent stuff… Finally harvested in the bullpen. Twins were dazzled by his 97 mph sinker and proceeded to turn him into a guy constantly behind in the count throwing breaking balls." The reality is the Twins kept him consistent in his sinker usage. "There's been suggestions that we have him throwing more offspeed pitches than in Baltimore," Falvey later refuted to Reusse. "That's not true. He's still throwing a lot of fastballs and with the same velocity." Which was an accurate statement but also… misleading. True, if you look at the overall pitch data of his sinker/two-seam fastball usage (50.3% in Baltimore and 50.9% with the Twins), they are basically the same. It is also true that López maintained that same crisp velocity in both uniforms (97.8 in Baltimore, 97.4 with the Twins). And finally, López threw more pitches while ahead in the count with the Twins than he did with the Orioles (so, no, he wasn’t “constantly behind in the count”). Falvey's narrative holds up as long as you only look as far as the total pitch type percentage and velocity. Consider two-strike counts. López used his sinker less frequently with the Twins — it went down from 47% to 40%. Equally as important was how he was using it. Watch this video. We have arrived at the point of the analysis where I post heat maps, charts, and video clips to support the trends and tendencies outlined above. I have done that and more but that content is reserved for Twins Daily Caretaker’s eyes only. Fear not: You too can become a Caretaker for as low as $4/month. In addition to getting to read the rest of the meaty López post, you also get free Twins Daily publications, Winter Meltdown tickets (WHICH ARE GOING EXTREMELY FAST) and other special recognition. Finally, if you do jump into the TD Caretaker pool and read the rest of this article and are not completely satisfied, you can totally call me out publicly on Twitter – @HagemanParker. View full article
-
 With the Orioles, Jorge López was a dominant backend of the bullpen arm, outfitted with an upper 90s sinker and wiffleball movement at the top of the zone. He had some intriguing offspeed stuff, was missing bats, and locking down games. The Twins may have thought they could take a pitcher right near the cusp of being elite and make him that much better. However, that initial experiment has backfired. What happened? Pick any stat you want from López and it was likely substantially worse with the Twins. Strikeouts? Down — from 28% with Baltimore to 16% with the Twins. Walk rate? Up — from 9% to 15%. Batting average allowed? Up — it was a clean 174 with Baltimore and grew to a grotesque 314 with the Twins. Hard hit balls? Up — exit velocity of balls over 95 mph went from 30% to 44%. Star Tribune columnist Patrick Reusse tweeted on September 20 that López "was tremendous and always had excellent stuff… Finally harvested in the bullpen. Twins were dazzled by his 97 mph sinker and proceeded to turn him into a guy constantly behind in the count throwing breaking balls." The reality is the Twins kept him consistent in his sinker usage. "There's been suggestions that we have him throwing more offspeed pitches than in Baltimore," Falvey later refuted to Reusse. "That's not true. He's still throwing a lot of fastballs and with the same velocity." Which was an accurate statement but also… misleading. True, if you look at the overall pitch data of his sinker/two-seam fastball usage (50.3% in Baltimore and 50.9% with the Twins), they are basically the same. It is also true that López maintained that same crisp velocity in both uniforms (97.8 in Baltimore, 97.4 with the Twins). And finally, López threw more pitches while ahead in the count with the Twins than he did with the Orioles (so, no, he wasn’t “constantly behind in the count”). Falvey's narrative holds up as long as you only look as far as the total pitch type percentage and velocity. Consider two-strike counts. López used his sinker less frequently with the Twins — it went down from 47% to 40%. Equally as important was how he was using it. Watch this video. We have arrived at the point of the analysis where I post heat maps, charts, and video clips to support the trends and tendencies outlined above. I have done that and more but that content is reserved for Twins Daily Caretaker’s eyes only. Fear not: You too can become a Caretaker for as low as $4/month. In addition to getting to read the rest of the meaty López post, you also get free Twins Daily publications, Winter Meltdown tickets (WHICH ARE GOING EXTREMELY FAST) and other special recognition. Finally, if you do jump into the TD Caretaker pool and read the rest of this article and are not completely satisfied, you can totally call me out publicly on Twitter – @HagemanParker.
 -
Jorge López's half-season with the Twins has people wondering if the team was hustled like some easy-mark Stanford grad on a Sicilian vacation. With the Orioles, López was a dominant backend of the bullpen arm, outfitted with an upper 90s sinker and wiffleball movement at the top of the zone. He had some intriguing offspeed stuff, was missing bats, and locking down games. The Twins may have thought they could take a pitcher right near the cusp of being elite and make him that much better. However, that initial experiment has backfired. What happened? Pick any stat you want from Jorge López and it was likely substantially worse with the Twins. Strikeouts? Down — from 28% with Baltimore to 16% with the Twins. Walk rate? Up — from 9% to 15%. Batting average allowed? Up — it was a clean 174 with Baltimore and grew to a grotesque 314 with the Twins. Hard hit balls? Up — exit velocity of balls over 95 mph went from 30% to 44%. Star Tribune columnist Patrick Reusse tweeted on September 20 that López "was tremendous and always had excellent stuff… Finally harvested in the bullpen. Twins were dazzled by his 97 mph sinker and proceeded to turn him into a guy constantly behind in the count throwing breaking balls." The reality is the Twins kept him consistent in his sinker usage. "There's been suggestions that we have him throwing more offspeed pitches than in Baltimore," Falvey later refuted to Reusse. "That's not true. He's still throwing a lot of fastballs and with the same velocity." Which was an accurate statement but also… misleading. True, if you look at the overall pitch data of his sinker/two-seam fastball usage (50.3% in Baltimore and 50.9% with the Twins), they are basically the same. It is also true that López maintained that same crisp velocity in both uniforms (97.8 in Baltimore, 97.4 with the Twins). And finally, López threw more pitches while ahead in the count with the Twins than he did with the Orioles (so, no, he wasn’t “constantly behind in the count”). Falvey's narrative holds up as long as you only look as far as the total pitch type percentage and velocity. Consider two-strike counts. López used his sinker less frequently with the Twins — it went down from 47% to 40%. Equally as important was how he was using it. Watch this video. Jorge Lopez Video.mp4 If you watched those clips and thought I was trying to hypnotize you by staring at the blobbies, here's what's up: With Baltimore, López threw his sinker at the top of the zone with 2-strikes. With the Twins, it was middle and down. With the Orioles, it was thrown with conviction and intent. In Minnesota, instead of ripping it, it feels like he was guiding it, trying to get the right amount of run and sink. He was trying to blow their doors off. Look at how much the performance suffered. Jorge López Sinker In 2-Strike Counts Thrown% K Upper 3rd% Swinging Strike% BAA BALT 46.5 26 69.3 16.7 .122 MINN 39.5 3 46.7 2.2 .227 It was not just that the sinker's use was limited with the Twins — he also was throwing more changeups in 2-strike counts. With the Orioles, López got a bulk of his strikeouts with his sinker and used his other pitches fairly evenly (sliders 18%, curveballs 14%, and change up 18%). Hitters held a .044 batting average against his non-fastballs with 2-strikes. The Twins had him use the sinker less and all but eliminated the slider from his arsenal in the 2-strike scenarios, throwing more changeups (35%) compared to sliders (4%) and curveballs (15%). Hitters posted a .286 batting average against those pitches. This is the element that Reusse was referring to, that López was not using his sinker as much and opting for other stuff (“throwing breaking balls”). When you look at his sinker's greasy metrics — such as tilt, release point, and movement — you'll find that it was a slightly different shape with the Orioles than it was with the Twins. The axis in which the ball spins out of his hand changed a bit (from 1:32 to 1:48), and his release point was about 2 inches lower (from 70.2 inches to 68.7 inches), and the vertical movement had two more inches of drop (from 8.9 induced vert to 6.7 induced vert). This was a concerted attempt at getting the ball to stay down in the zone. SINKER LOCATION (ORIOLES VS TWINS) It cannot be said with absolute certainty because no one has publicly acknowledged this, but the Twins have encouraged Jorge to adjust his sinker. The working theory is that by throwing it down in the zone, he can pair it better with his changeup (a solid pitch in its own right). Like the sinker, López slightly altered his changeup at release (different spin axis, lower release, etc.) and induced more horizontal run and drop. Those results were positive. CHANGEUP LOCATION (ORIOLES VS TWINS) Jorge López Changeup Thrown% Swing% K Zone% Swinging Strike % BALT 15 43.5 6 31 14 MINN 17 42.1 9 24 24 In short, López’s changeup benefitted from the modification of his sinker whereas his sinker’s performance -- his prime pitch with the O’s – suffered. Plenty of what López is going through stems from the tough lessons the Twins learned in the Ryan Pressly trade. Notoriously Presley was traded to the Astros and was told to spin it. Spin it good. He did and went from a pitcher with excellent stuff to a lights-out All-Star closer. "It was a very hard lesson and very discouraging for us," Assistant General Manager Daniel Adler said in October 2018. "On the other hand, in some ways, it was a really strong teachable moment for us. … In some ways, I think it makes it easier to go to the next player." To ensure they never fail to communicate information like that again, the Twins built a strong bridge that extends from the player development system into the clubhouse. Knowledge discovered in the front office is integrated into the day-to-day. Pitchers acquired – no matter how much success they are having at their previous stop – will receive information to optimize them, be it through an arsenal change, mechanical tweak, or something else. Kenta Maeda. Chris Paddack. Matt Shoemaker. Sonny Gray. Jharel Cotton. Nobody is a finished product. With the Twins, Jorge López has gone down the same path to middling results. The changeup seems much improved and could be an excellent weapon. On the other hand, they may have come at the expense of his sinker's performance – especially in those 2-strike situations. There appear to be crossroads ahead. López will be part of the 2023 bullpen, but what will his approach be? Will he continue to lean into the sinker/changeup mix, hoping to perfect that combination by next season? Or will he return to throwing moving heat at the top of the zone? View full article
-
 With the Orioles, López was a dominant backend of the bullpen arm, outfitted with an upper 90s sinker and wiffleball movement at the top of the zone. He had some intriguing offspeed stuff, was missing bats, and locking down games. The Twins may have thought they could take a pitcher right near the cusp of being elite and make him that much better. However, that initial experiment has backfired. What happened? Pick any stat you want from Jorge López and it was likely substantially worse with the Twins. Strikeouts? Down — from 28% with Baltimore to 16% with the Twins. Walk rate? Up — from 9% to 15%. Batting average allowed? Up — it was a clean 174 with Baltimore and grew to a grotesque 314 with the Twins. Hard hit balls? Up — exit velocity of balls over 95 mph went from 30% to 44%. Star Tribune columnist Patrick Reusse tweeted on September 20 that López "was tremendous and always had excellent stuff… Finally harvested in the bullpen. Twins were dazzled by his 97 mph sinker and proceeded to turn him into a guy constantly behind in the count throwing breaking balls." The reality is the Twins kept him consistent in his sinker usage. "There's been suggestions that we have him throwing more offspeed pitches than in Baltimore," Falvey later refuted to Reusse. "That's not true. He's still throwing a lot of fastballs and with the same velocity." Which was an accurate statement but also… misleading. True, if you look at the overall pitch data of his sinker/two-seam fastball usage (50.3% in Baltimore and 50.9% with the Twins), they are basically the same. It is also true that López maintained that same crisp velocity in both uniforms (97.8 in Baltimore, 97.4 with the Twins). And finally, López threw more pitches while ahead in the count with the Twins than he did with the Orioles (so, no, he wasn’t “constantly behind in the count”). Falvey's narrative holds up as long as you only look as far as the total pitch type percentage and velocity. Consider two-strike counts. López used his sinker less frequently with the Twins — it went down from 47% to 40%. Equally as important was how he was using it. Watch this video. Jorge Lopez Video.mp4 If you watched those clips and thought I was trying to hypnotize you by staring at the blobbies, here's what's up: With Baltimore, López threw his sinker at the top of the zone with 2-strikes. With the Twins, it was middle and down. With the Orioles, it was thrown with conviction and intent. In Minnesota, instead of ripping it, it feels like he was guiding it, trying to get the right amount of run and sink. He was trying to blow their doors off. Look at how much the performance suffered. Jorge López Sinker In 2-Strike Counts Thrown% K Upper 3rd% Swinging Strike% BAA BALT 46.5 26 69.3 16.7 .122 MINN 39.5 3 46.7 2.2 .227 It was not just that the sinker's use was limited with the Twins — he also was throwing more changeups in 2-strike counts. With the Orioles, López got a bulk of his strikeouts with his sinker and used his other pitches fairly evenly (sliders 18%, curveballs 14%, and change up 18%). Hitters held a .044 batting average against his non-fastballs with 2-strikes. The Twins had him use the sinker less and all but eliminated the slider from his arsenal in the 2-strike scenarios, throwing more changeups (35%) compared to sliders (4%) and curveballs (15%). Hitters posted a .286 batting average against those pitches. This is the element that Reusse was referring to, that López was not using his sinker as much and opting for other stuff (“throwing breaking balls”). When you look at his sinker's greasy metrics — such as tilt, release point, and movement — you'll find that it was a slightly different shape with the Orioles than it was with the Twins. The axis in which the ball spins out of his hand changed a bit (from 1:32 to 1:48), and his release point was about 2 inches lower (from 70.2 inches to 68.7 inches), and the vertical movement had two more inches of drop (from 8.9 induced vert to 6.7 induced vert). This was a concerted attempt at getting the ball to stay down in the zone. SINKER LOCATION (ORIOLES VS TWINS) It cannot be said with absolute certainty because no one has publicly acknowledged this, but the Twins have encouraged Jorge to adjust his sinker. The working theory is that by throwing it down in the zone, he can pair it better with his changeup (a solid pitch in its own right). Like the sinker, López slightly altered his changeup at release (different spin axis, lower release, etc.) and induced more horizontal run and drop. Those results were positive. CHANGEUP LOCATION (ORIOLES VS TWINS) Jorge López Changeup Thrown% Swing% K Zone% Swinging Strike % BALT 15 43.5 6 31 14 MINN 17 42.1 9 24 24 In short, López’s changeup benefitted from the modification of his sinker whereas his sinker’s performance -- his prime pitch with the O’s – suffered. Plenty of what López is going through stems from the tough lessons the Twins learned in the Ryan Pressly trade. Notoriously Presley was traded to the Astros and was told to spin it. Spin it good. He did and went from a pitcher with excellent stuff to a lights-out All-Star closer. "It was a very hard lesson and very discouraging for us," Assistant General Manager Daniel Adler said in October 2018. "On the other hand, in some ways, it was a really strong teachable moment for us. … In some ways, I think it makes it easier to go to the next player." To ensure they never fail to communicate information like that again, the Twins built a strong bridge that extends from the player development system into the clubhouse. Knowledge discovered in the front office is integrated into the day-to-day. Pitchers acquired – no matter how much success they are having at their previous stop – will receive information to optimize them, be it through an arsenal change, mechanical tweak, or something else. Kenta Maeda. Chris Paddack. Matt Shoemaker. Sonny Gray. Jharel Cotton. Nobody is a finished product. With the Twins, Jorge López has gone down the same path to middling results. The changeup seems much improved and could be an excellent weapon. On the other hand, they may have come at the expense of his sinker's performance – especially in those 2-strike situations. There appear to be crossroads ahead. López will be part of the 2023 bullpen, but what will his approach be? Will he continue to lean into the sinker/changeup mix, hoping to perfect that combination by next season? Or will he return to throwing moving heat at the top of the zone?
 -
A Former Insider's Thoughts on Losing the Big Fish
Parker Hageman replied to jdgoin's topic in Twins Daily Front Page News
✋ question for @jdgoin: there is a narrative that the twins "missed" out on other free agents while waiting on Correa's decision. from your experience, do teams "miss" players when they are targeting one or do they conduct due diligence and make an informed decision on who to target, keep multiple conversations going, etc? for example, if one team, say the twins, are targeting a premium shortstop named, say, karlos korrea, would they then neglect to try to acquire a pitcher like karlos rodawn? or does the pursuit of korrea hinder a team's ability to make other signings, thereby allowing other teams to swoop in? -
Glen Perkins Headlines the Winter Meltdown
Parker Hageman replied to John Bonnes's topic in Twins Daily Front Page News
ok, shut it down. no winter meltdown this year. we'll try again next year. sorry everyone. sorry. -
Great write-up Matthew.
-
Excellent question. I will connect with the TD leadership committee and see how we can make that happen.
-
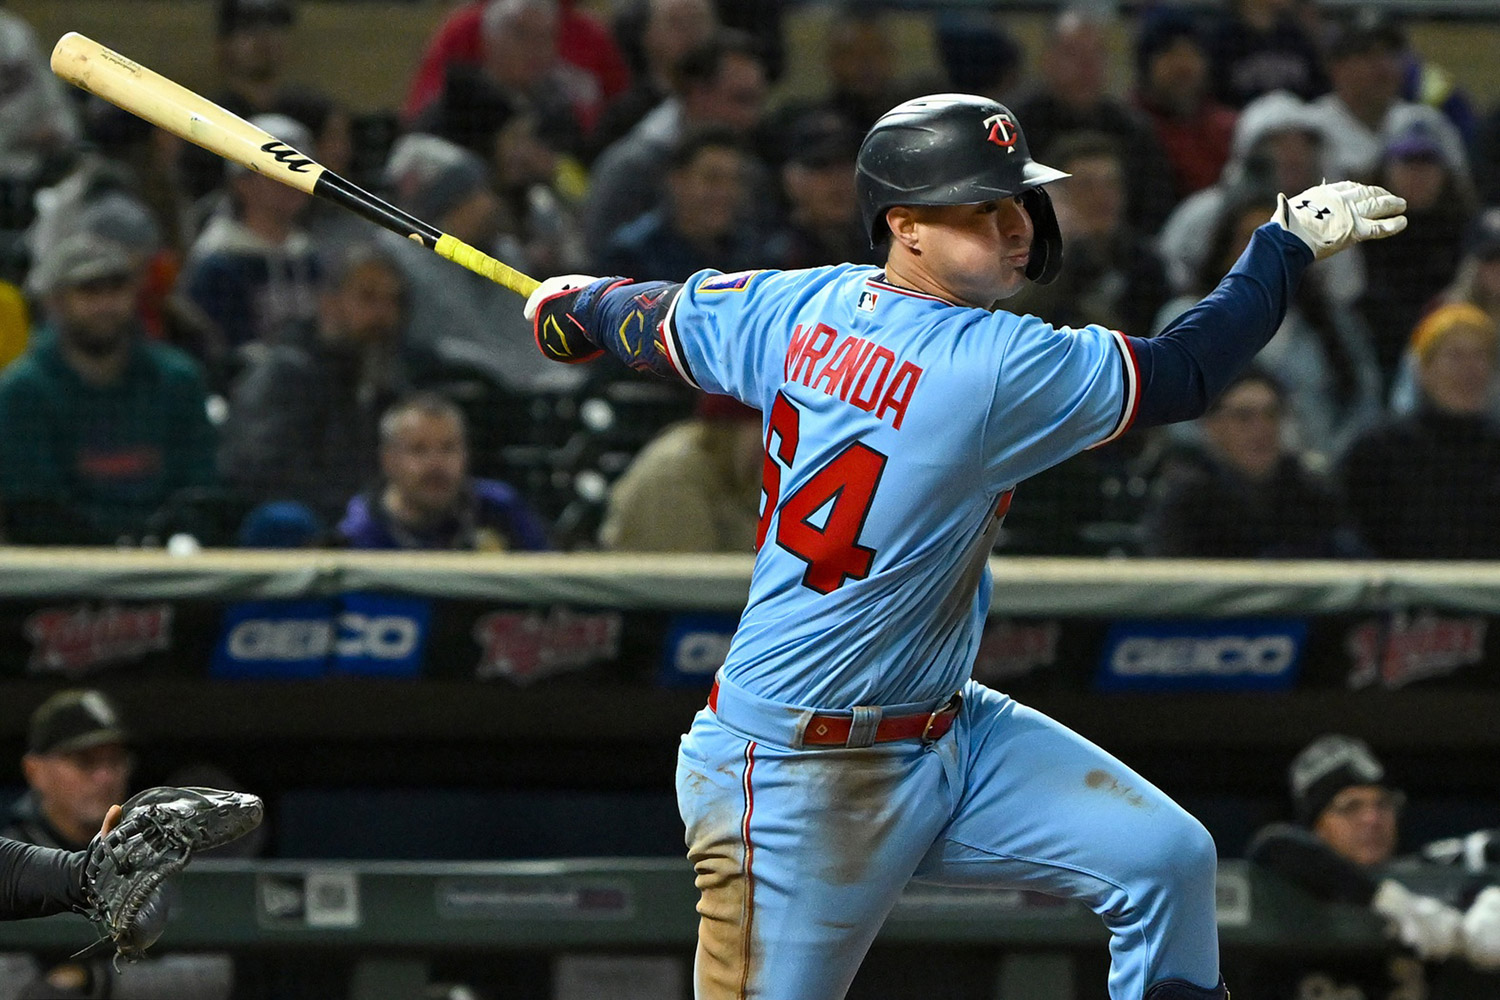
FullSizeRender.MOV I asked Miranda on Friday if he felt teams adjusted to him. Obviously a very standard response and he didn’t expand on it (it’s a media day, I didn’t expect him to wade too far into the weeds) but I did like his confidence.
-
It’s hard not to like what Jose Miranda brings to the Twins’ offense. After an initial slow start in May, he quickly caught fire and elevated himself to one of the more reliable bats in the lineup: In 150 plate appearances in June and July, he posted a .329/.373/.557 slash line while adding 8 home runs. He had the presence of a savvy veteran, taking professional at bats and spraying line drives all around the field. Image courtesy of © Nick Wosika-USA TODAY Sports Nevertheless, Miranda’s performance began to cool in August and leveled out for the remainder of the year. He hit .262 over his final 136 plate appearances with far less power production. How did teams adjust to him and what does it say about his potential going forward? Before we start disparaging Miranda’s late season performance, let’s consider some of his strengths. His 117 weighted runs created plus – a rate stat that takes into consideration park factors and current run environment of the league – was the seventh best by a Minnesota Twins rookie and tied with notable legend Rod Carew. From June through August, he led the team with 49 runs driven in and collected 74 hits (behind the eventual AL hit king, Luis Arraez). He was anointed the AL’s Rookie of the Month in July. He carried the Twins offense as best he could through a stretch in which the team was preparing for a late season nosedive. In that time Miranda showed a keen ability to hit non-fastballs well. His .325 average against non-fastballs during that stretch was the 5th best in major league baseball. This is noteworthy considering how often rookie hitters struggle with spin: Over the last ten years, rookies have posted a .230/.270/.378 line against non-fastballs. Unsurprisingly, pitchers adjusted their game plan to Miranda after he showed the propensity to wallop non-fastballs left in the strike zone. In August, teams started to shift to throwing him more sliders and locating them off the plate. Miranda began to swing more often and chased more frequently and so teams continued that trend throughout the rest of the season. Miranda did an exceptional job of ambushing pitchers early in the count and this coincided with his ability to hit in-zone breaking balls hard. As pitchers tried to use get-me-over breaking balls to work ahead early, Miranda would attack. Spotting this trend, teams adjusted their approach and began to throw him breaking stuff away rather than risk catching too much of the zone. Let’s acknowledge here that the division of the data is not as clean as simply turning the calendar. Teams did not wake up on September 1st and decided to throw Miranda more sweeping sliders off the plate – they started to phase those in more in August. But that strategy proved fruitful and likely enticed other teams to follow suit. Miranda’s success may have prompted another strategy for the opposition. Earlier in the year, he held an average platoon advantage rate against relief pitchers. Meaning that teams were not necessarily ensuring they would gain an edge with a right-handed pitcher on the mound. This year, right-handed hitters in baseball had the platoon advantage against relief pitching in 23.6% of the plate appearances. From June through August, Miranda was at 21.6% (but he held a 27% advantage in June and July alone). Platoon Advantage % MLB Platoon (RP vs RHB) 24% Miranda RP Platoon (June-July) 27% Miranda RP Platoon (Sept-Oct) 10% There are two reasons why teams began to make sure they had a right-handed pitcher on the mound when Miranda came to the plate. The first is simple lineup construction. In June and July, Miranda often hit behind left-handed sluggers like Trevor Larnach and Alex Kirilloff. Opponents were more likely to use a lefty reliever against Larnach and Kirilloff while rolling the dice for an at bat with Miranda. Meanwhile, in August and after, Miranda was hitting behind Correa and Buxton. Once Larnach and Kirilloff were out of the lineup, teams were able to use a nasty righty reliever against Miranda – especially considering he was positioned with Correa ahead of him and Nick Gordon (who hit .190 against all relievers from June onward) following him. Miranda’s percentage of plate appearances with the platoon advantage fell from 21.6% to 10.4%. Similarly, like the blobby heat map above suggests, teams realized that they could stymie him with sliders and they would dispatch relievers to do just that. In his hot stretch, he saw sliders 27% of the time. During the last month and change, he got sliders 47% of the time out of the pen. Miranda Vs Relievers (Pitch Selection) Date Slider% June-July 27% September-October 47% So those factors explain some of the decline in the latter portion of the season. The other element was how Miranda slowly incorporated bigger movements into his swing. Take a look at the video below: What started to happen in August is that Miranda’s barrel tip – a rhythm mechanism during the load process that some hitters use to time up a pitcher – got more pronounced. His hands got lower and further away from his body as he would tip the barrel further toward the left-handed batters’ box. Why this happened is unclear. It’s possible that the movement slowly got bigger as Miranda felt the need to add more power to his swing. After all, his home run totals sagged later in the year and as someone in the heart of the order, he may have felt the need to press. Similarly, Miranda may have also been aware that pitchers were throwing him more offspeed and breaking balls and the added movement was meant to keep him back for a split second longer. However, it is hard to subscribe to the latter theory since he was so successful against breaking stuff previous to the late season issues. Admittedly, Miranda would get to the same launch point (which some would argue is more essential than anything else) at roughly the same time but it’s hard not to conclude that the additional movement is mucking up the system in his timing and swing pattern to some degree. Fractions of inches and seconds matter a lot when trying to get to a round ball on time. The combination of the two – a change in how teams were attacking him as well as the small adjustment in his swing pattern – may have been a reason why his late season performance dipped. There is a lot to like about Miranda’s future based on his recent past. You have to appreciate how well he was able to hit spin as well as fastballs. The key will be to adjust to that outside slider and stay locked in on spin middle-in. His flatter bat path allowed him to maintain optimal launch angle better than most rookies (31.7% of his balls in play were between 10 and 30 degrees – 3rd highest rate among rookies) and allowed him to spray the ball to all fields with strength in the barrel (his 93 MPH average exit velo to center was the 2nd highest among rookies). As hot as Miranda was for the two month stretch in June and July, it is difficult to envision him maintaining that pace over an entire season. Likewise, with his offensive tools and consistent ability to perform at every minor league level, it’s hard to see him replicating the September/October performance for a long stretch, too. Based on his swing and his tendency to adjust, Jose Miranda will continue to find success at the plate. Look for him to be an offensive force in the middle of the order. View full article
-
 Nevertheless, Miranda’s performance began to cool in August and leveled out for the remainder of the year. He hit .262 over his final 136 plate appearances with far less power production. How did teams adjust to him and what does it say about his potential going forward? Before we start disparaging Miranda’s late season performance, let’s consider some of his strengths. His 117 weighted runs created plus – a rate stat that takes into consideration park factors and current run environment of the league – was the seventh best by a Minnesota Twins rookie and tied with notable legend Rod Carew. From June through August, he led the team with 49 runs driven in and collected 74 hits (behind the eventual AL hit king, Luis Arraez). He was anointed the AL’s Rookie of the Month in July. He carried the Twins offense as best he could through a stretch in which the team was preparing for a late season nosedive. In that time Miranda showed a keen ability to hit non-fastballs well. His .325 average against non-fastballs during that stretch was the 5th best in major league baseball. This is noteworthy considering how often rookie hitters struggle with spin: Over the last ten years, rookies have posted a .230/.270/.378 line against non-fastballs. Unsurprisingly, pitchers adjusted their game plan to Miranda after he showed the propensity to wallop non-fastballs left in the strike zone. In August, teams started to shift to throwing him more sliders and locating them off the plate. Miranda began to swing more often and chased more frequently and so teams continued that trend throughout the rest of the season. Miranda did an exceptional job of ambushing pitchers early in the count and this coincided with his ability to hit in-zone breaking balls hard. As pitchers tried to use get-me-over breaking balls to work ahead early, Miranda would attack. Spotting this trend, teams adjusted their approach and began to throw him breaking stuff away rather than risk catching too much of the zone. Let’s acknowledge here that the division of the data is not as clean as simply turning the calendar. Teams did not wake up on September 1st and decided to throw Miranda more sweeping sliders off the plate – they started to phase those in more in August. But that strategy proved fruitful and likely enticed other teams to follow suit. Miranda’s success may have prompted another strategy for the opposition. Earlier in the year, he held an average platoon advantage rate against relief pitchers. Meaning that teams were not necessarily ensuring they would gain an edge with a right-handed pitcher on the mound. This year, right-handed hitters in baseball had the platoon advantage against relief pitching in 23.6% of the plate appearances. From June through August, Miranda was at 21.6% (but he held a 27% advantage in June and July alone). Platoon Advantage % MLB Platoon (RP vs RHB) 24% Miranda RP Platoon (June-July) 27% Miranda RP Platoon (Sept-Oct) 10% There are two reasons why teams began to make sure they had a right-handed pitcher on the mound when Miranda came to the plate. The first is simple lineup construction. In June and July, Miranda often hit behind left-handed sluggers like Trevor Larnach and Alex Kirilloff. Opponents were more likely to use a lefty reliever against Larnach and Kirilloff while rolling the dice for an at bat with Miranda. Meanwhile, in August and after, Miranda was hitting behind Correa and Buxton. Once Larnach and Kirilloff were out of the lineup, teams were able to use a nasty righty reliever against Miranda – especially considering he was positioned with Correa ahead of him and Nick Gordon (who hit .190 against all relievers from June onward) following him. Miranda’s percentage of plate appearances with the platoon advantage fell from 21.6% to 10.4%. Similarly, like the blobby heat map above suggests, teams realized that they could stymie him with sliders and they would dispatch relievers to do just that. In his hot stretch, he saw sliders 27% of the time. During the last month and change, he got sliders 47% of the time out of the pen. Miranda Vs Relievers (Pitch Selection) Date Slider% June-July 27% September-October 47% So those factors explain some of the decline in the latter portion of the season. The other element was how Miranda slowly incorporated bigger movements into his swing. Take a look at the video below: What started to happen in August is that Miranda’s barrel tip – a rhythm mechanism during the load process that some hitters use to time up a pitcher – got more pronounced. His hands got lower and further away from his body as he would tip the barrel further toward the left-handed batters’ box. Why this happened is unclear. It’s possible that the movement slowly got bigger as Miranda felt the need to add more power to his swing. After all, his home run totals sagged later in the year and as someone in the heart of the order, he may have felt the need to press. Similarly, Miranda may have also been aware that pitchers were throwing him more offspeed and breaking balls and the added movement was meant to keep him back for a split second longer. However, it is hard to subscribe to the latter theory since he was so successful against breaking stuff previous to the late season issues. Admittedly, Miranda would get to the same launch point (which some would argue is more essential than anything else) at roughly the same time but it’s hard not to conclude that the additional movement is mucking up the system in his timing and swing pattern to some degree. Fractions of inches and seconds matter a lot when trying to get to a round ball on time. The combination of the two – a change in how teams were attacking him as well as the small adjustment in his swing pattern – may have been a reason why his late season performance dipped. There is a lot to like about Miranda’s future based on his recent past. You have to appreciate how well he was able to hit spin as well as fastballs. The key will be to adjust to that outside slider and stay locked in on spin middle-in. His flatter bat path allowed him to maintain optimal launch angle better than most rookies (31.7% of his balls in play were between 10 and 30 degrees – 3rd highest rate among rookies) and allowed him to spray the ball to all fields with strength in the barrel (his 93 MPH average exit velo to center was the 2nd highest among rookies). As hot as Miranda was for the two month stretch in June and July, it is difficult to envision him maintaining that pace over an entire season. Likewise, with his offensive tools and consistent ability to perform at every minor league level, it’s hard to see him replicating the September/October performance for a long stretch, too. Based on his swing and his tendency to adjust, Jose Miranda will continue to find success at the plate. Look for him to be an offensive force in the middle of the order.
 -
It’s hard not to like what Jose Miranda brings to the Twins’ offense. After an initial slow start in May, he quickly caught fire and elevated himself to one of the more reliable bats in the lineup: In 150 plate appearances in June and July, he posted a .329/.373/.557 slash line while adding 8 home runs. He had the presence of a savvy veteran, taking professional at-bats and spraying line drives all around the field. Nevertheless, Miranda’s performance began to cool in August and leveled out for the remainder of the year. He hit .262 over his final 136 plate appearances with far less power production. How did teams adjust to him and what does it say about his potential going forward? Image courtesy of Nick Wosika-USA TODAY Sports Before we start disparaging Miranda’s late-season performance, let’s consider some of his strengths. His 117 weighted runs created plus – a rate stat that takes into consideration park factors and current run environment of the league – was the seventh-best by a Minnesota Twins rookie and tied with notable legend Rod Carew. From June through August, he led the team with 49 runs driven in and collected 74 hits (behind the eventual AL hit king, Luis Arraez). He was anointed the AL’s Rookie of the Month in July. He carried the Twins offense as best he could through a stretch in which the team was preparing for a late season nosediIn that time Miranda showed a keen ability to hit non-fastballs well. His .325 average against non-fastballs during that stretch was the 5th best in major league baseball. This is noteworthy considering how often rookie hitters struggle with spin: Over the last ten years, rookies have posted a .230/.270/.378 line against non-fastballs. Unsurprisingly, pitchers adjusted their game plan to Miranda after he showed the propensity to wallop non-fastballs left in the strike zone. In August, teams started to shift to throwing him more sliders and locating them off the plate. Miranda began to swing more often and chased more frequently and so teams continued that trend throughout the rest of the season. We have arrived at the point of the analysis where I normally post heat maps, charts, and video clips to support the trends and tendencies outlined above. I have done that and more but that content is reserved for Twins Daily Caretaker’s eyes only. Fear not: You too can become a Caretaker for as low as $4/month. In addition to getting to read the rest of the meaty Miranda post, you also get free Twins Daily publications, Winter Meltdown tickets and other special recognition. Finally, if you do jump into the TD Caretaker pool and read the rest of this article and are not completely satisfied, you can totally call me out publicly on Twitter – @HagemanParker -- and… I will likely mute you. I have a very fragile ego. View full article
-
What Happened to Jose Miranda's Swing During the 2022 Season? (Excerpt)
Parker Hageman posted an article in Twins
 Before we start disparaging Miranda’s late-season performance, let’s consider some of his strengths. His 117 weighted runs created plus – a rate stat that takes into consideration park factors and current run environment of the league – was the seventh-best by a Minnesota Twins rookie and tied with notable legend Rod Carew. From June through August, he led the team with 49 runs driven in and collected 74 hits (behind the eventual AL hit king, Luis Arraez). He was anointed the AL’s Rookie of the Month in July. He carried the Twins offense as best he could through a stretch in which the team was preparing for a late season nosediIn that time Miranda showed a keen ability to hit non-fastballs well. His .325 average against non-fastballs during that stretch was the 5th best in major league baseball. This is noteworthy considering how often rookie hitters struggle with spin: Over the last ten years, rookies have posted a .230/.270/.378 line against non-fastballs. Unsurprisingly, pitchers adjusted their game plan to Miranda after he showed the propensity to wallop non-fastballs left in the strike zone. In August, teams started to shift to throwing him more sliders and locating them off the plate. Miranda began to swing more often and chased more frequently and so teams continued that trend throughout the rest of the season. We have arrived at the point of the analysis where I normally post heat maps, charts, and video clips to support the trends and tendencies outlined above. I have done that and more but that content is reserved for Twins Daily Caretaker’s eyes only. Fear not: You too can become a Caretaker for as low as $4/month. In addition to getting to read the rest of the meaty Miranda post, you also get free Twins Daily publications, Winter Meltdown tickets and other special recognition. Finally, if you do jump into the TD Caretaker pool and read the rest of this article and are not completely satisfied, you can totally call me out publicly on Twitter – @HagemanParker -- and… I will likely mute you. I have a very fragile ego.
 -
Parker breaks down Jose Miranda's swing from early 2022 - when he was successfully driving the ball with authority - and shows how that differed from his late-season swing when he was struggling to make solid contact. View full video
-
Parker breaks down Jose Miranda's swing from early 2022 - when he was successfully driving the ball with authority - and shows how that differed from his late-season swing when he was struggling to make solid contact.