



ashbury
-
Posts
42,456 -
Joined
-
Last visited
-
Days Won
470
Content Type
Profiles
News
Minnesota Twins Videos
2026 Minnesota Twins Top Prospects Ranking
2022 Minnesota Twins Draft Picks
Minnesota Twins Free Agent & Trade Rumors, Notes, & Tidbits
Guides & Resources
2023 Minnesota Twins Draft Picks
The Minnesota Twins Players Project
2024 Minnesota Twins Draft Picks
2025 Minnesota Twins Draft Pick Tracker
2026 Minnesota Twins Draft Tracker: Picks & Bonuses
Forums
Blogs
Events
Store
Downloads
Gallery
Everything posted by ashbury
-
 A player is never as good as he seems when he's going well, and never as bad as he seems when things are down. In his first 24 games (72 plate appearances) Martin's OPS was .995. His batting average on balls in play was .415. Since then in 53 games (185 PA) his OPS has been .549 but his BABIP has been only .258. .300 has been a good rule of thumb for BABIP for a long time, but more precisely it's been more like .290 across the majors lately (.289 this season so far). I never call BABIP "luck." You put the ball in play and sometimes the fielders catch it and sometimes they don't but in every case the players are trying their best so it's nothing like rolling dice or dealing cards. Some batters maintain a high BABIP throughout their careers (Joe Mauer's was .341), likewise some pitchers can keep it low (Kershaw .275) so I consider it a certain sort of skill that is measurable. But it can represent an ebb and flow to the game until the sample size is large enough to stabilize. So for the season as a whole Martin's OPS is .664 and it's built on a BABIP of .295. which doesn't look too far outside the norms. BABIP has been an up and down factor in our perceptions of him all along the way this season, but overall it's at a level you might expect to remain stable now, though his prior two partial seasons had a BABIP more like .320 so maybe he's still got some upward movement coming to him. But his season numbers are probably about who he is at the present time. He could improve in ways outside of BABIP (cutting down Ks, raising BBs or HRs), but is getting kind of old for that kind of expectation. He is who he is by now.
 -
Grading the Twins Through the Season's First Half
ashbury replied to Cody Christie's topic in Twins Daily Front Page News
The league average for pitches per plate appearance is 3.87. Joe's this year is 4.03 and Zebby's is 3.68. Little things like this - some batter fouling off a good 2-strike pitch instead of whiffing - can alter the course of a game and with enough time a season. Joe's always run a little high in this metric. He gets to 90 pitches a little sooner than he might and the manager has to start thinking about the bullpen. / edit: I just want to add that pitches per PA isn't much of a metric for how good a pitcher is. Luis Garcia was 3.57, Justin Lawrence was 4.18. Both were terrible. Pit/PA only has bearing if a pitcher is good and you want him to face as many batters as possible.- 39 replies
-
- 4
-

-
- byron buxton
- joe ryan
- (and 8 more)
-
Twins (Matthews) VS Astros (Lambert): 6/29/26 7:10pm CDT
ashbury replied to Mortimerkenny21's topic in Archived Game Threads
He should go to church. -
Twins (Matthews) VS Astros (Lambert): 6/29/26 7:10pm CDT
ashbury replied to Mortimerkenny21's topic in Archived Game Threads
Concur. The porch in LF is a travesty. Used to be worse with the hill in center field. My biggest gripe is the piped in crowd noise, which was ridiculous during their down years when the actual attendance was in the low thousands - I bet they still supplement the actual cheering, though it's probably less obtrusive. -
Twins (Matthews) VS Astros (Lambert): 6/29/26 7:10pm CDT
ashbury replied to Mortimerkenny21's topic in Archived Game Threads
On viewing Caratini's home run, I was interested to see that they seem to have sold the stadium naming rights to a new partner.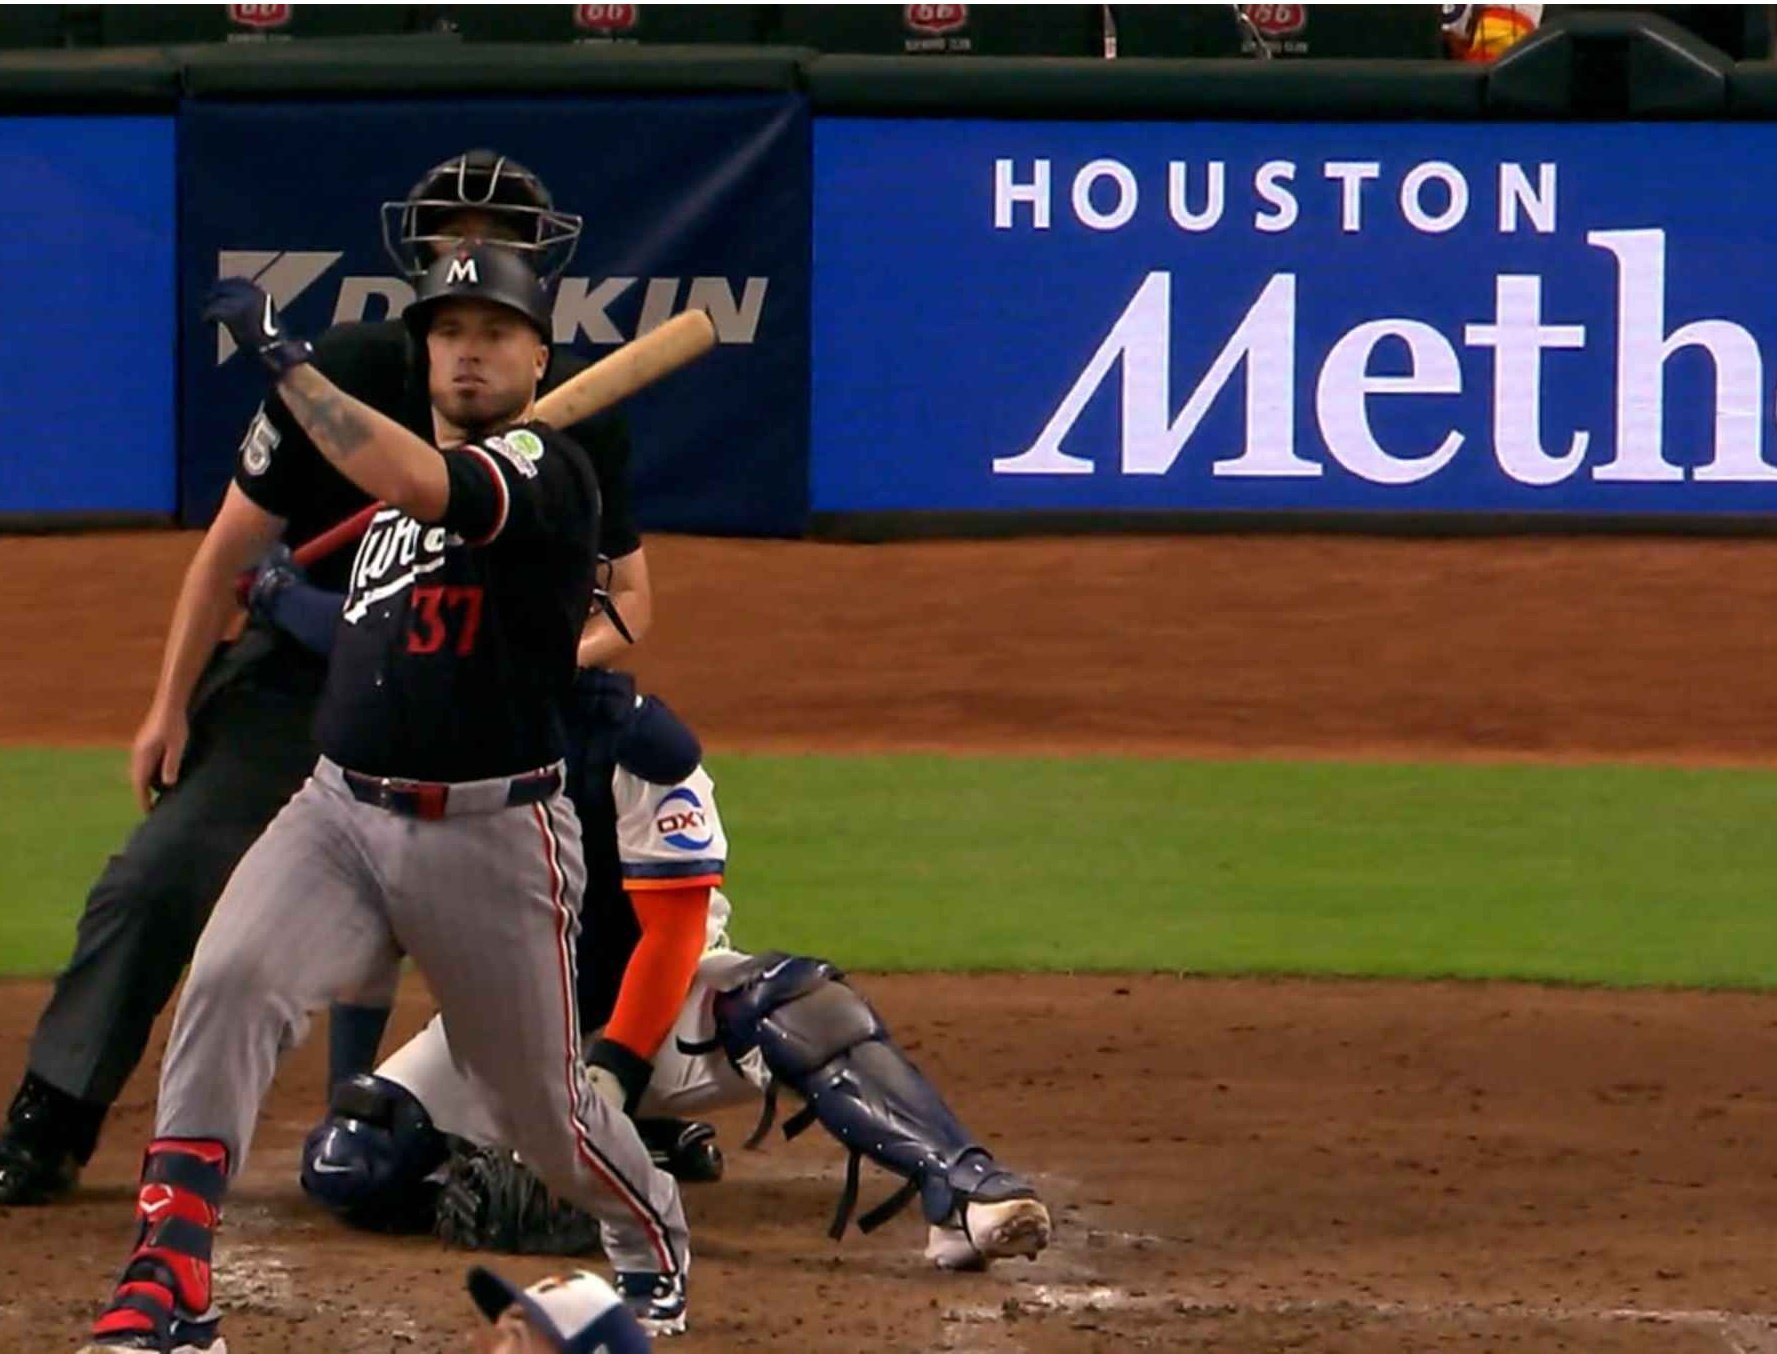
-
There's a reason up the middle are called "skill" positions, and corner outfield is not.
-
You just spelled out exactly the bias. I could point to Ryan Kreidler and Yoendrys Gómez as proof of success for the Twins' bottom-feeding tactics for player acquisition. I don't use the term "bias" to imply bad intent. But when analyzing large sets of data, some care is needed. It's fine to use a biased data set if you are intrigued by a potential insight, to see whether something might be there. But then you need to validate the conclusion you want to draw by also looking at the contrapositive.
-
Week in Review: The Pendulum Swings
ashbury replied to Nick Nelson's topic in Twins Daily Front Page News
The power of Ryan compels you. -
Week in Review: The Pendulum Swings
ashbury replied to Nick Nelson's topic in Twins Daily Front Page News
Cream rises to the top. Water, by contrast, seeks its own level. Anyway, I have joined the Church of Kreidler, but currently occupy one of the back pews. -
Hey, you know what, I happened to recheck, and that's a bad take of mine. There was that 9-pitch start this year where Ryan had to come out. That's what reduced his pitch/inning count per game this year.
-
The glut of corner outfielders leads me to expect multiple trades soon. But then I thought the same a year ago and we actually added another.
-
Ryan pitched more innings per start, and threw more pitches per start, last year than in 2026. / edit - oops, that's a bad take of mine. See below.
- 33 replies
-
- 2
-
-
- royce lewis
- tom pohlad
- (and 3 more)
-
Week in Review: The Pendulum Swings
ashbury replied to Nick Nelson's topic in Twins Daily Front Page News
Just goes to show how crucially important it is to get the right hitting coach. -
-
Wow, four pitches from Gomez, three outs.
-
Such as the choice to use Funderburk rather than Rogers yesterday? Maybe these are 10/10 pitching choices. 😉
-
Could Twins use Hot Streak of Bell to get Bullpen help?
ashbury replied to Trov's topic in Minnesota Twins Talk
How much do you think a contender is willing to shell out for a guy they can reasonably expect to fade by the time the post-season starts? -
Connecting the two clauses I highlighted, don't you think there is at least a teensy risk that statistical bias was introduced?
-
Cruz was indeed a late bloomer, but in AAA at age 27 (same as Sabato) he was putting up an OPS of 1.123. Granted that Oklahoma City tends to inflate batting numbers, but we're saying the same of all of AAA these past several years. Sabato has a ways to go before Nelson Cruz becomes a meaningful comp, which you acknowledge, so I'm not quite sure the real point of invoking him.
- 9 replies
-
- 1
-
-
- minor league report
- ty langenberg
- (and 8 more)
-
You also said we're all just effing around. This is a game thread, where that goes double. Enjoy.
-
Noam Chomsky says Appeal to Authority is the worst logical fallacy.
-
Video: Austin Martin's Season Has Completely Flipped
ashbury replied to Sam Caulder's topic in Twins Daily Front Page News
Yes.™