
TwinsData
-
Posts
44 -
Joined
-
Last visited
Content Type
Profiles
News
Minnesota Twins Videos
2026 Minnesota Twins Top Prospects Ranking
2022 Minnesota Twins Draft Picks
Minnesota Twins Free Agent & Trade Rumors, Notes, & Tidbits
Guides & Resources
2023 Minnesota Twins Draft Picks
The Minnesota Twins Players Project
2024 Minnesota Twins Draft Picks
2025 Minnesota Twins Draft Pick Tracker
2026 Minnesota Twins Draft Pick Tracker
Forums
Blogs
Events
Store
Downloads
Gallery
Everything posted by TwinsData
-
 A manager's decision to pull a starting pitcher or squeeze another inning out of them is often criticized. Rocco Baldelli, who tends to pull pitchers quickly, is no exception. But what goes into that decision and how should we assess the effectiveness of Baldelli's quick hook? The above graph shows OPS (on-base percentage plus slugging percentage) against each starting pitcher separated by times through the order. So for example, it shows that hitters have a 0.786 OPS when hitting against Joe Ryan for the second time in a game. The size of the points indicate fraction of pitches. Chris Archer has only pitched to 10 hitters for a third time in a game (mercifully, it seems). The pattern for most pitchers is clear: the scales tip toward the batter with each successive time through the lineup. So for Rocco Baldelli, the urge to call on the bullpen should strengthen each time opposing lineups turn over. For comparison's sake, consider the group of middle relievers comprised of Tyler Duffey, Caleb Thielbar, Emilio Pagán, Jovani Moran, and Trevor Megill. That group has an OPS against of 0.636. So while turning to the bullpen often has not been pretty, it's still a much better option than having the likes of Chris Archer, Dylan Bundy, or Devin Smeltzer face a hitter for a 3rd time. View full article
- 21 replies
-
- 1
-

-
- rocco baldelli
- joe ryan
- (and 3 more)
-
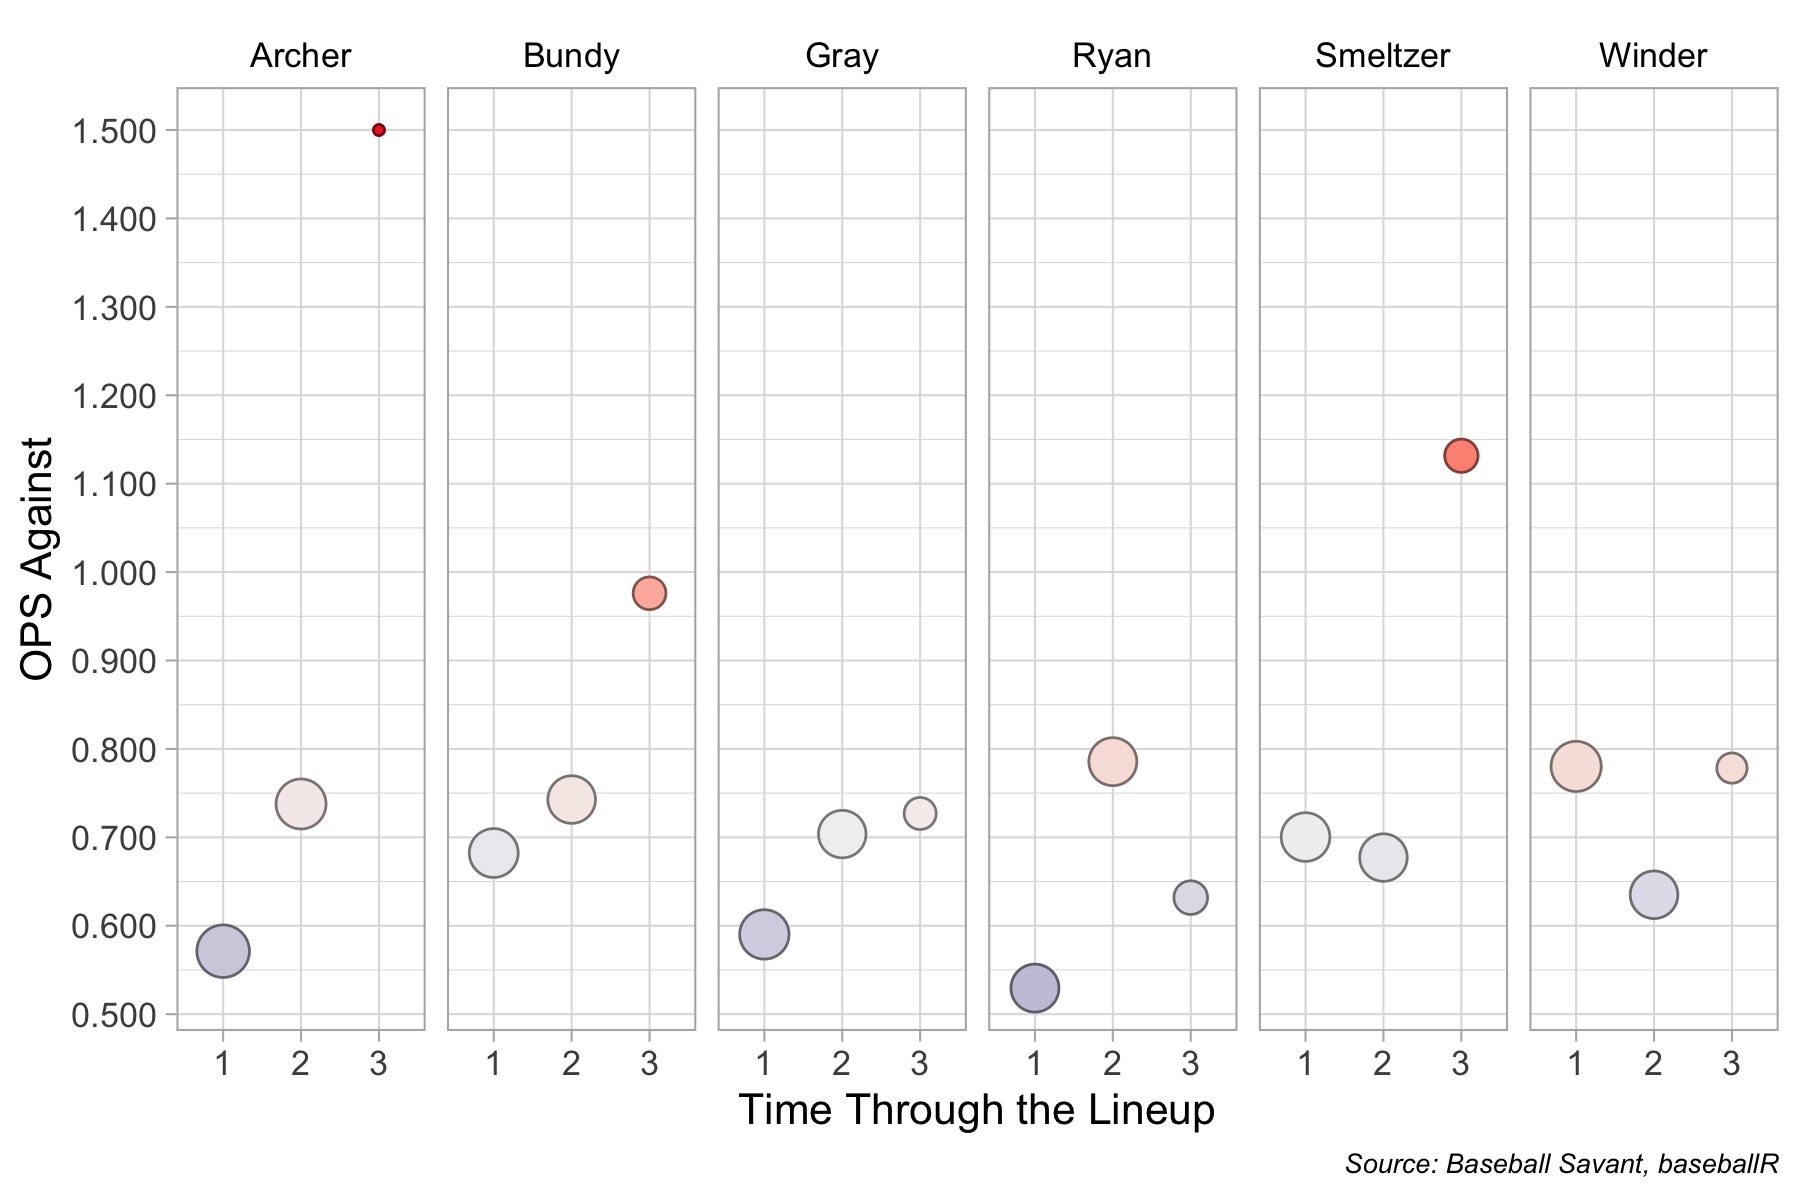 The above graph shows OPS (on-base percentage plus slugging percentage) against each starting pitcher separated by times through the order. So for example, it shows that hitters have a 0.786 OPS when hitting against Joe Ryan for the second time in a game. The size of the points indicate fraction of pitches. Chris Archer has only pitched to 10 hitters for a third time in a game (mercifully, it seems). The pattern for most pitchers is clear: the scales tip toward the batter with each successive time through the lineup. So for Rocco Baldelli, the urge to call on the bullpen should strengthen each time opposing lineups turn over. For comparison's sake, consider the group of middle relievers comprised of Tyler Duffey, Caleb Thielbar, Emilio Pagán, Jovani Moran, and Trevor Megill. That group has an OPS against of 0.636. So while turning to the bullpen often has not been pretty, it's still a much better option than having the likes of Chris Archer, Dylan Bundy, or Devin Smeltzer face a hitter for a 3rd time.
- 21 comments
-
- 2
-
-
- rocco baldelli
- joe ryan
- (and 3 more)
-
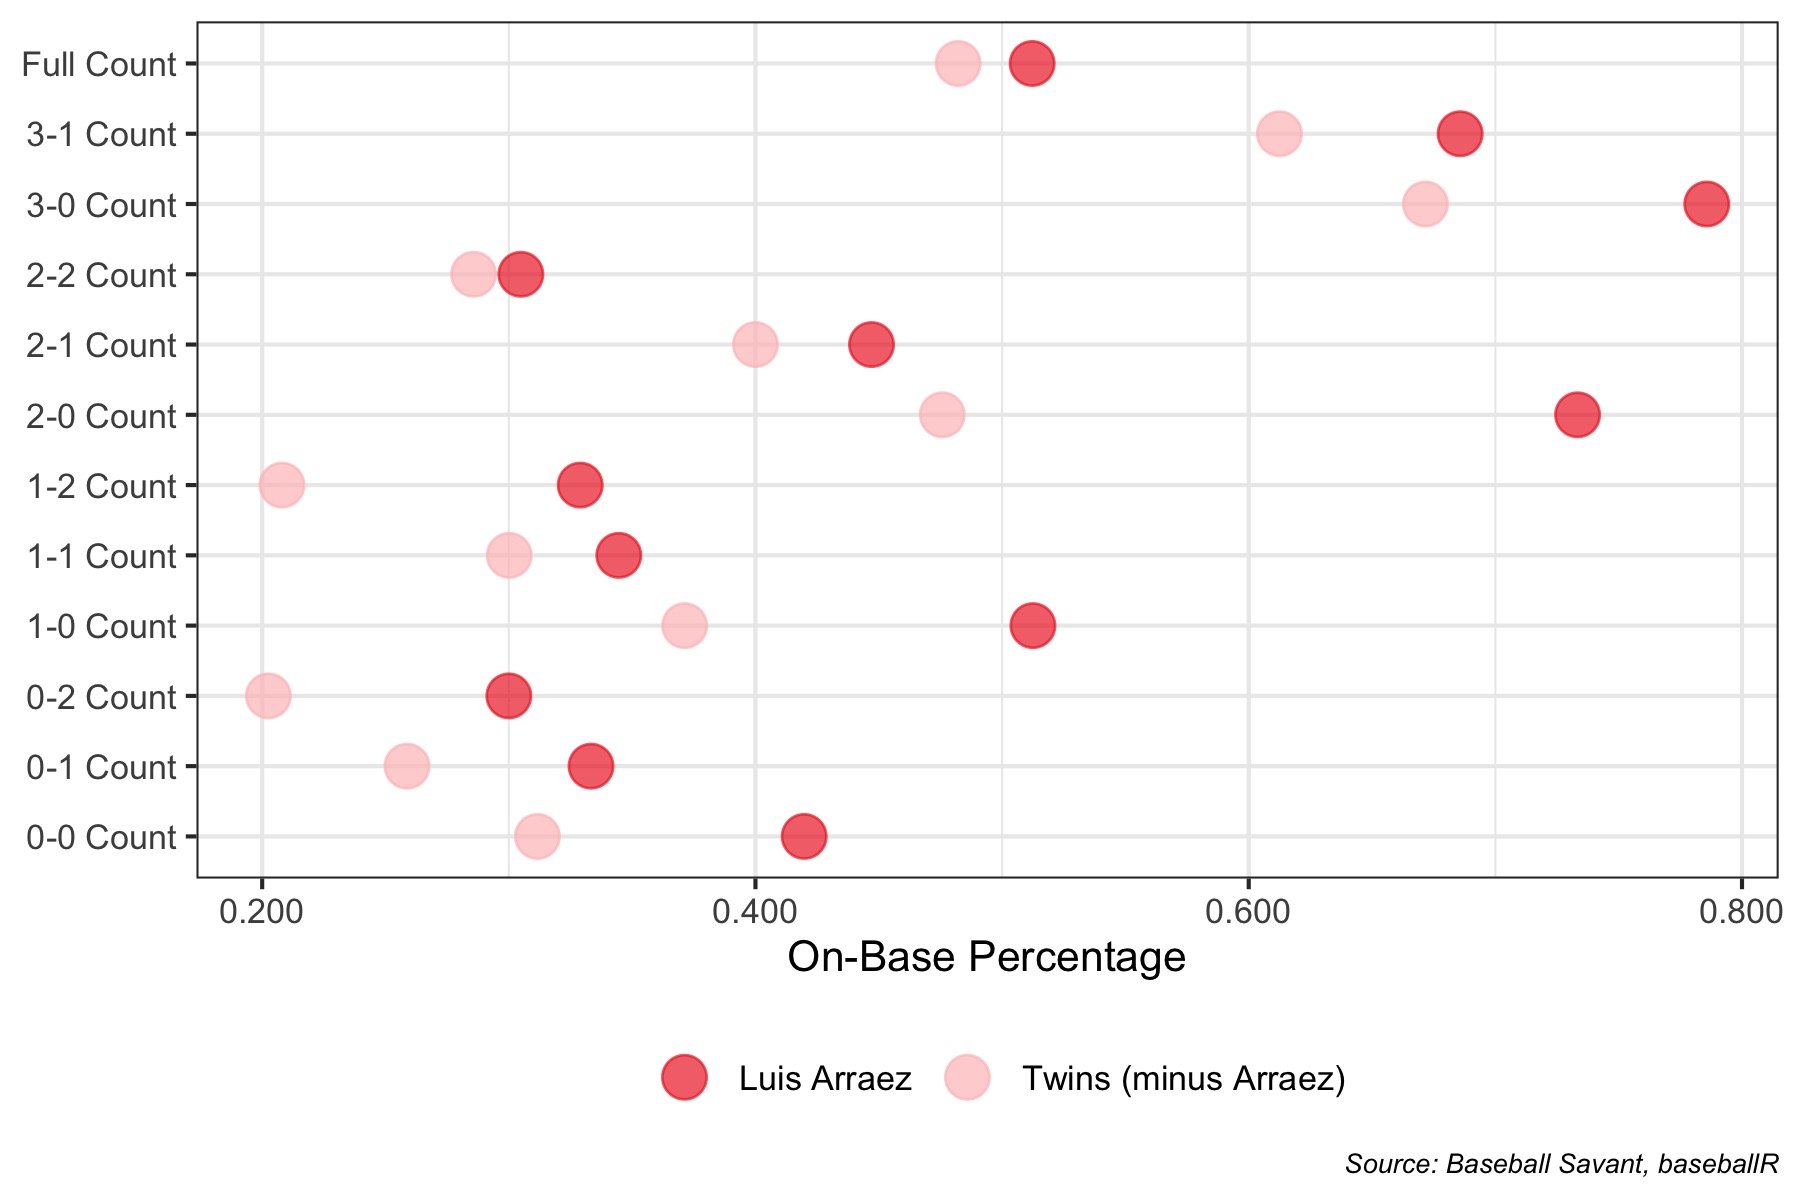 The above chart shows Arraez's on-base percentage (as well as the on-base percentage of his teammates as a group) after combining all the at-bats that had a given count. So for example, his on-base percentage from a 0-0 count is his published on-base percentage (an AL-high 0.420) and his on-base percentage from 1-0 is his on-base percentage for all at-bats that begin with a ball. Here are the things that stand out: Luis Arraez is better at getting on base from every count than his teammates. That's not a huge surprise. Arraez is better from an 0-1 count (0.333 on-base percentage) than his teammates are from 0-0 (0.312 on-base percentage). In fact, only 5 Twins hitters have higher on-base percentages from 0-0 than Arraez from 0-1 counts. Getting to 2 strikes doesn't faze Arraez much. Look at the loss in on-base percentage for his Twins peers in going from 0-1 to 0-2 or 1-1 to 1-2. It's substantial. But not so for Arraez. He loses barely any on-base percentage from taking a second strike. From 0-2 counts, Arraez has an incredible 0.300 on-base percentage. He's more likely to get on base behind 0-2 than are Byron Buxton, Jose Miranda, Ryan Jeffers, and Gary Sanchez from empty counts. Falling behind Arraez in the count is a death sentence for pitchers. He has a 0.513 on-base percentage from 1-0 counts and a 0.733 on-base percentage (!) from 2-0 counts. The hallmark of a great contact hitter is the lack of any clear weakness to exploit. Because of his ability to handle the bat and trouble pitchers from any count, Arraez clearly has that trait. He's a savant at the plate and now a deserving All-Star.
 -
Luis Arraez has been named to his first All-Star team, so it seems appropriate to reflect on what makes him such a dynamic hitter. What differentiates him from the rest of the Twins lineup? The above chart shows Arraez's on-base percentage (as well as the on-base percentage of his teammates as a group) after combining all the at-bats that had a given count. So for example, his on-base percentage from a 0-0 count is his published on-base percentage (an AL-high 0.420) and his on-base percentage from 1-0 is his on-base percentage for all at-bats that begin with a ball. Here are the things that stand out: Luis Arraez is better at getting on base from every count than his teammates. That's not a huge surprise. Arraez is better from an 0-1 count (0.333 on-base percentage) than his teammates are from 0-0 (0.312 on-base percentage). In fact, only 5 Twins hitters have higher on-base percentages from 0-0 than Arraez from 0-1 counts. Getting to 2 strikes doesn't faze Arraez much. Look at the loss in on-base percentage for his Twins peers in going from 0-1 to 0-2 or 1-1 to 1-2. It's substantial. But not so for Arraez. He loses barely any on-base percentage from taking a second strike. From 0-2 counts, Arraez has an incredible 0.300 on-base percentage. He's more likely to get on base behind 0-2 than are Byron Buxton, Jose Miranda, Ryan Jeffers, and Gary Sanchez from empty counts. Falling behind Arraez in the count is a death sentence for pitchers. He has a 0.513 on-base percentage from 1-0 counts and a 0.733 on-base percentage (!) from 2-0 counts. The hallmark of a great contact hitter is the lack of any clear weakness to exploit. Because of his ability to handle the bat and trouble pitchers from any count, Arraez clearly has that trait. He's a savant at the plate and now a deserving All-Star. View full article
-
With the trade deadline in less than a month, the Twins will be out looking for bullpen help in the trade market. But they can only acquire so many new arms. Some of the in-house options will have to fill important roles down the stretch. Who should they turn to? The chart above lists the current options in the Twins bullpen ranked from top to bottom by their measures in three underlying statistics: strike percentage, whiff rate (the fraction of swings that are misses), and average exit velocity. Red circles are good, blue circles are not so good. There's a simple rule of thumb for reading these statistics. A pitcher ought to have strong measures in two of the three statistics to be effective. For example, Jhoan Duran can give up hard contact as shown by his team-average exit velocity. But he pounds the strike zone and hitters rarely catch up to him. That's effective. Using similar assessments, the Twins ought to carve out roles for Caleb Thielbar and Griffin Jax. Jovani Moran may prove to be a bit of a wild card. He has a team-high 38% whiff rate and limits hard contact. If he can keep the ball in the strike zone often enough to avoid costly walks, he would prove valuable. Danny Coulombe may also warrant another shot when he returns to full health. What about Emilio Pagán, Tyler Duffey, and Joe Smith? Have they simply gotten unlucky in big moments despite pitching well? Not exactly. Pagán gets hit harder than any other Twins reliever and doesn't miss bats often enough to hide that. Duffey's numbers paint him as a poor man's Pagán. Smith has a paltry 13% whiff rate, which means he rarely misses bats. That's a big problem since his exit velocities are also quite high. The Twins will surely add to their bullpen through trades. But they can also get more out of their bullpen by redefining roles, tweaking pitcher usage, and perhaps letting go of a few veterans. View full article
-
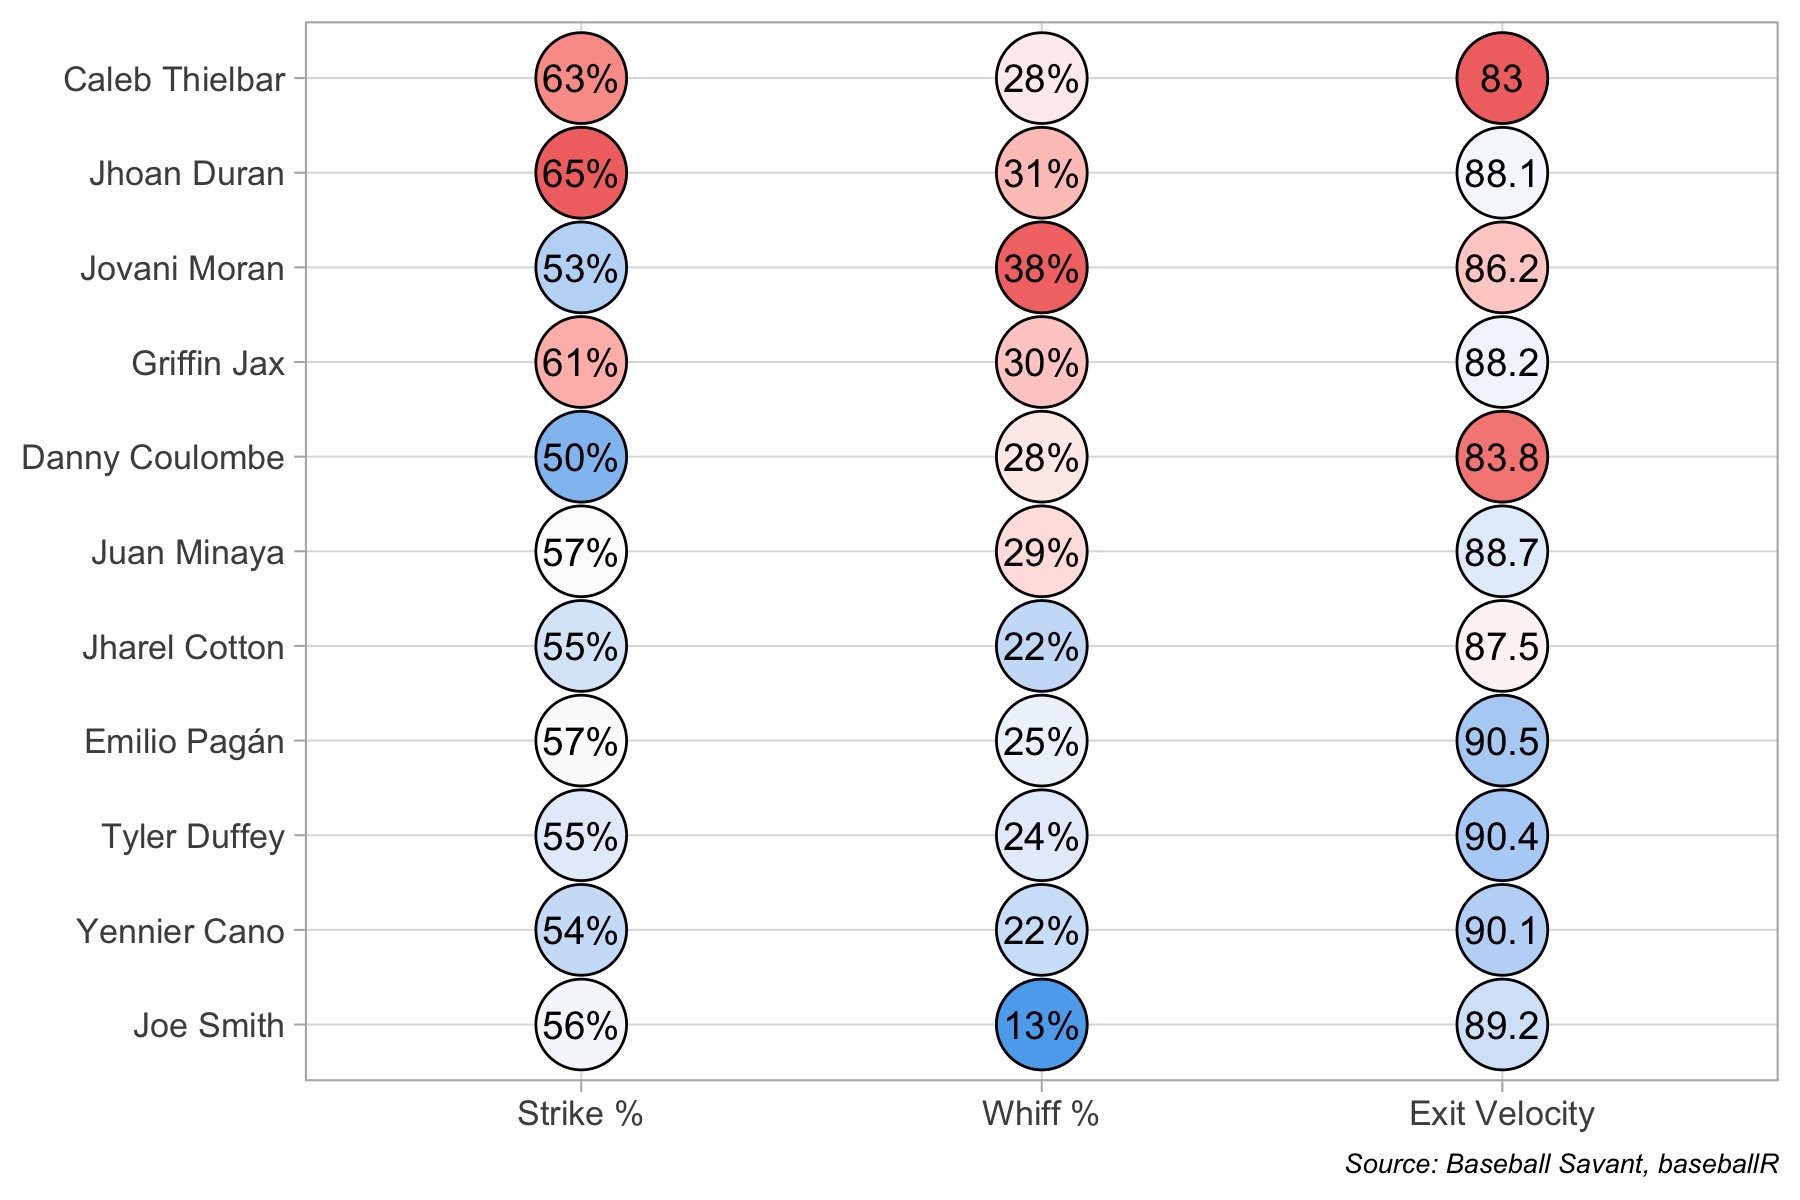 The chart above lists the current options in the Twins bullpen ranked from top to bottom by their measures in three underlying statistics: strike percentage, whiff rate (the fraction of swings that are misses), and average exit velocity. Red circles are good, blue circles are not so good. There's a simple rule of thumb for reading these statistics. A pitcher ought to have strong measures in two of the three statistics to be effective. For example, Jhoan Duran can give up hard contact as shown by his team-average exit velocity. But he pounds the strike zone and hitters rarely catch up to him. That's effective. Using similar assessments, the Twins ought to carve out roles for Caleb Thielbar and Griffin Jax. Jovani Moran may prove to be a bit of a wild card. He has a team-high 38% whiff rate and limits hard contact. If he can keep the ball in the strike zone often enough to avoid costly walks, he would prove valuable. Danny Coulombe may also warrant another shot when he returns to full health. What about Emilio Pagán, Tyler Duffey, and Joe Smith? Have they simply gotten unlucky in big moments despite pitching well? Not exactly. Pagán gets hit harder than any other Twins reliever and doesn't miss bats often enough to hide that. Duffey's numbers paint him as a poor man's Pagán. Smith has a paltry 13% whiff rate, which means he rarely misses bats. That's a big problem since his exit velocities are also quite high. The Twins will surely add to their bullpen through trades. But they can also get more out of their bullpen by redefining roles, tweaking pitcher usage, and perhaps letting go of a few veterans.
- 14 comments
-
- 3
-
-
- jhoan duran
- griffin jax
- (and 3 more)
-
After going 30-21 through April and May, the Twins have stalled in the standings in June despite a surging lineup. Which hitters have driven the increased production and which have taken a step back? The above graph shows each hitter's June OPS (on-base plus slugging percentage) compared to their OPS from April & May. A few notes: Team OPS in April & May: 0.684 ... team OPS in June: 0.720 The biggest boost is Alex Kirilloff, whose newfound comfort in his wrist will change the Twins lineup for the better. The biggest June bust is Trevor Larnach, whose core injury surely played a part. The Twins have also gotten big improvements in June from Byron Buxton, Carlos Correa, and Jorge Polanco. It's clear that the top half of the Twins lineup will be a force to be reckoned with going forward. Is it time to start giving José Miranda a more regular role? With an 0.862 OPS, he outperformed both Gio Urshela and Gary Sánchez in June, two players whose positions (3B and DH respectively) Miranda could adequately fill. If the Twins bullpen can find its feet, they should get back on track in July, because almost every part of this lineup is heating up. View full article
- 8 replies
-
- 1
-
-
- alex kirilloff
- byron buxton
- (and 2 more)
-
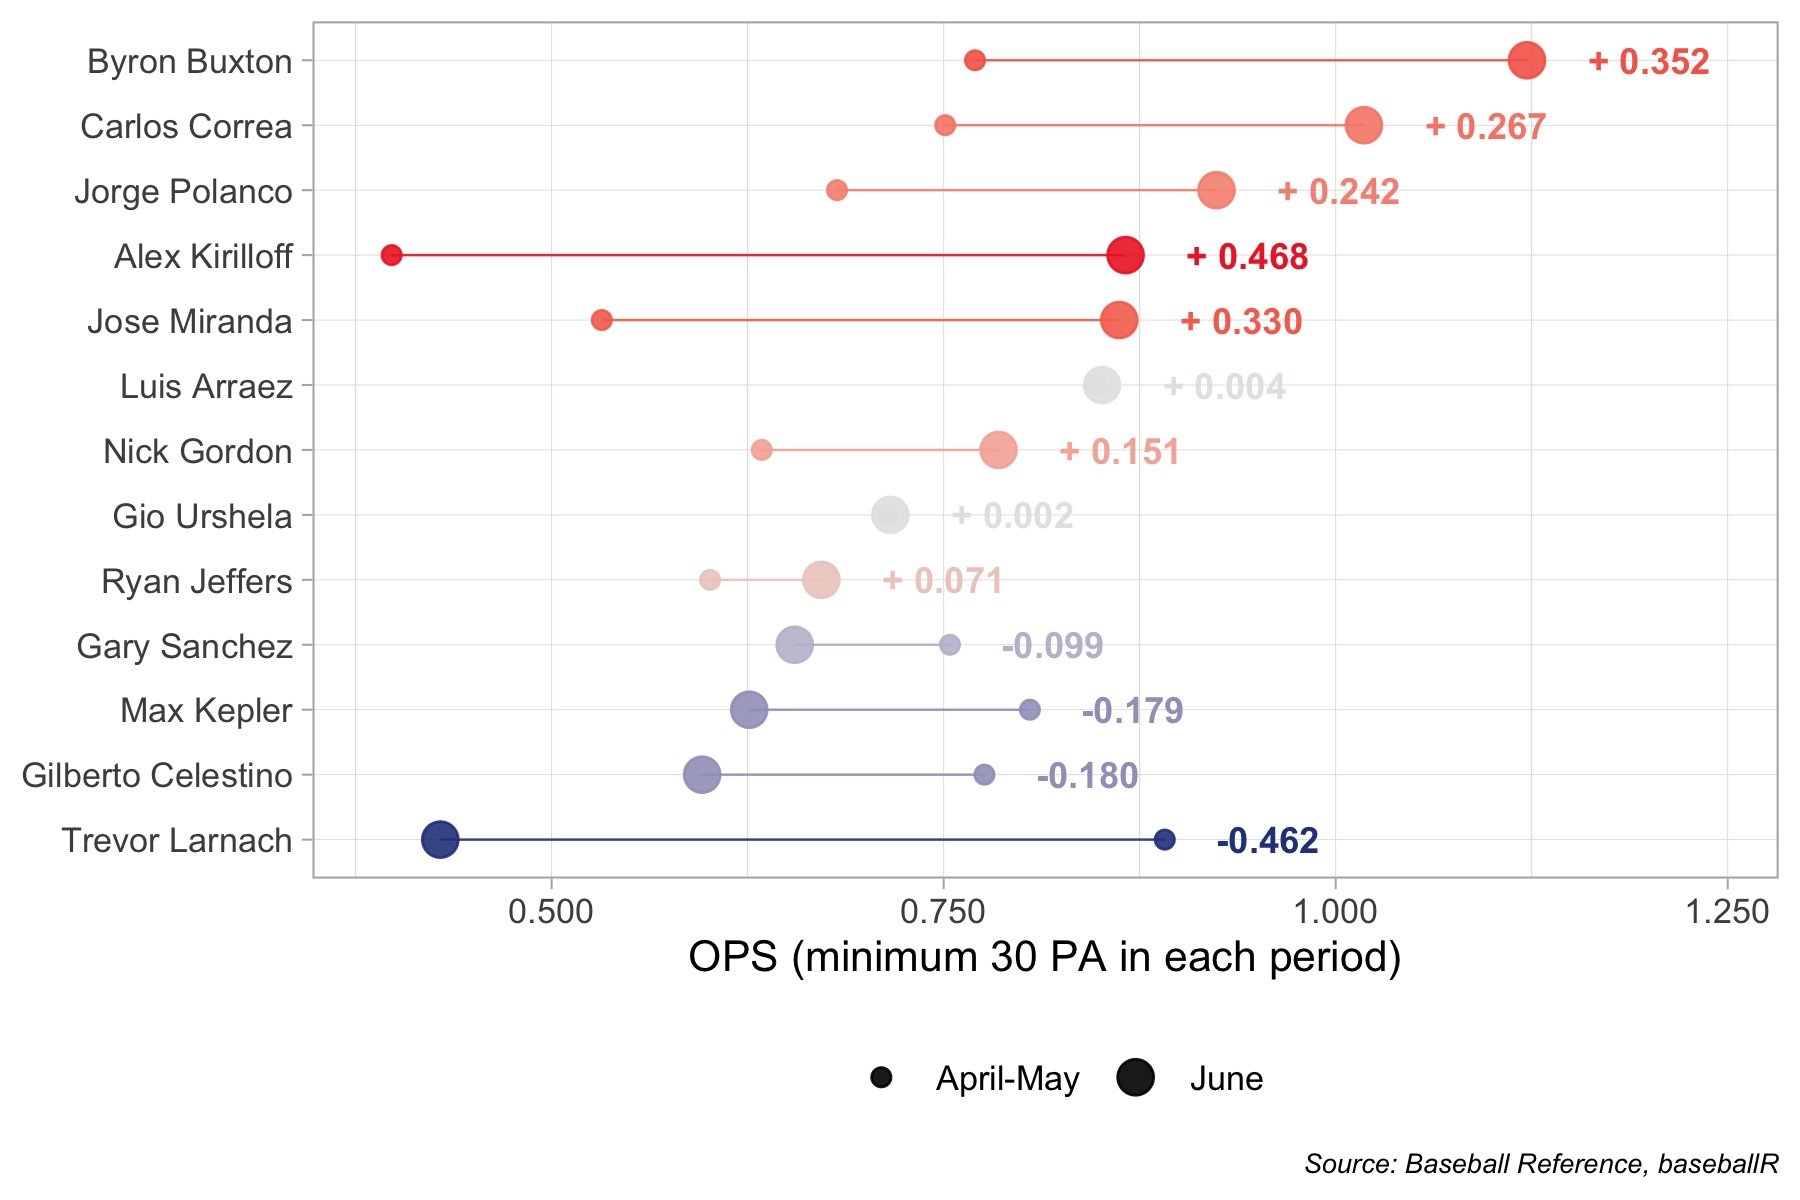 The above graph shows each hitter's June OPS (on-base plus slugging percentage) compared to their OPS from April & May. A few notes: Team OPS in April & May: 0.684 ... team OPS in June: 0.720 The biggest boost is Alex Kirilloff, whose newfound comfort in his wrist will change the Twins lineup for the better. The biggest June bust is Trevor Larnach, whose core injury surely played a part. The Twins have also gotten big improvements in June from Byron Buxton, Carlos Correa, and Jorge Polanco. It's clear that the top half of the Twins lineup will be a force to be reckoned with going forward. Is it time to start giving José Miranda a more regular role? With an 0.862 OPS, he outperformed both Gio Urshela and Gary Sánchez in June, two players whose positions (3B and DH respectively) Miranda could adequately fill. If the Twins bullpen can find its feet, they should get back on track in July, because almost every part of this lineup is heating up.
- 8 comments
-
- 5
-
-
- alex kirilloff
- byron buxton
- (and 2 more)
-
The Twins tried to address Alex Kirilloff's wrist woes by letting him bash Triple-A pitching for more than a month. After almost two weeks back with the Twins, has the plan worked? The above graph shows the exit velocity of each ball put into play by Alex Kirilloff, separated by stints in the majors. A few notes: Of the 45 balls in play this season, the seven hardest-hit balls have all been hit since returning to the lineup in June. Average exit velocity in April and May: 86.7 ... average exit velocity in June: 93.8. All four of his extra-base hits have come in June. With these new-and-improved exit velocities, the extra-base hits are only going to keep coming. Kirilloff's first home run of 2022 should also come sooner rather than later. As his season-long numbers continue to climb, Kirilloff's name ought to be in the lineup every day. Here's to continued wrist health. View full article
-
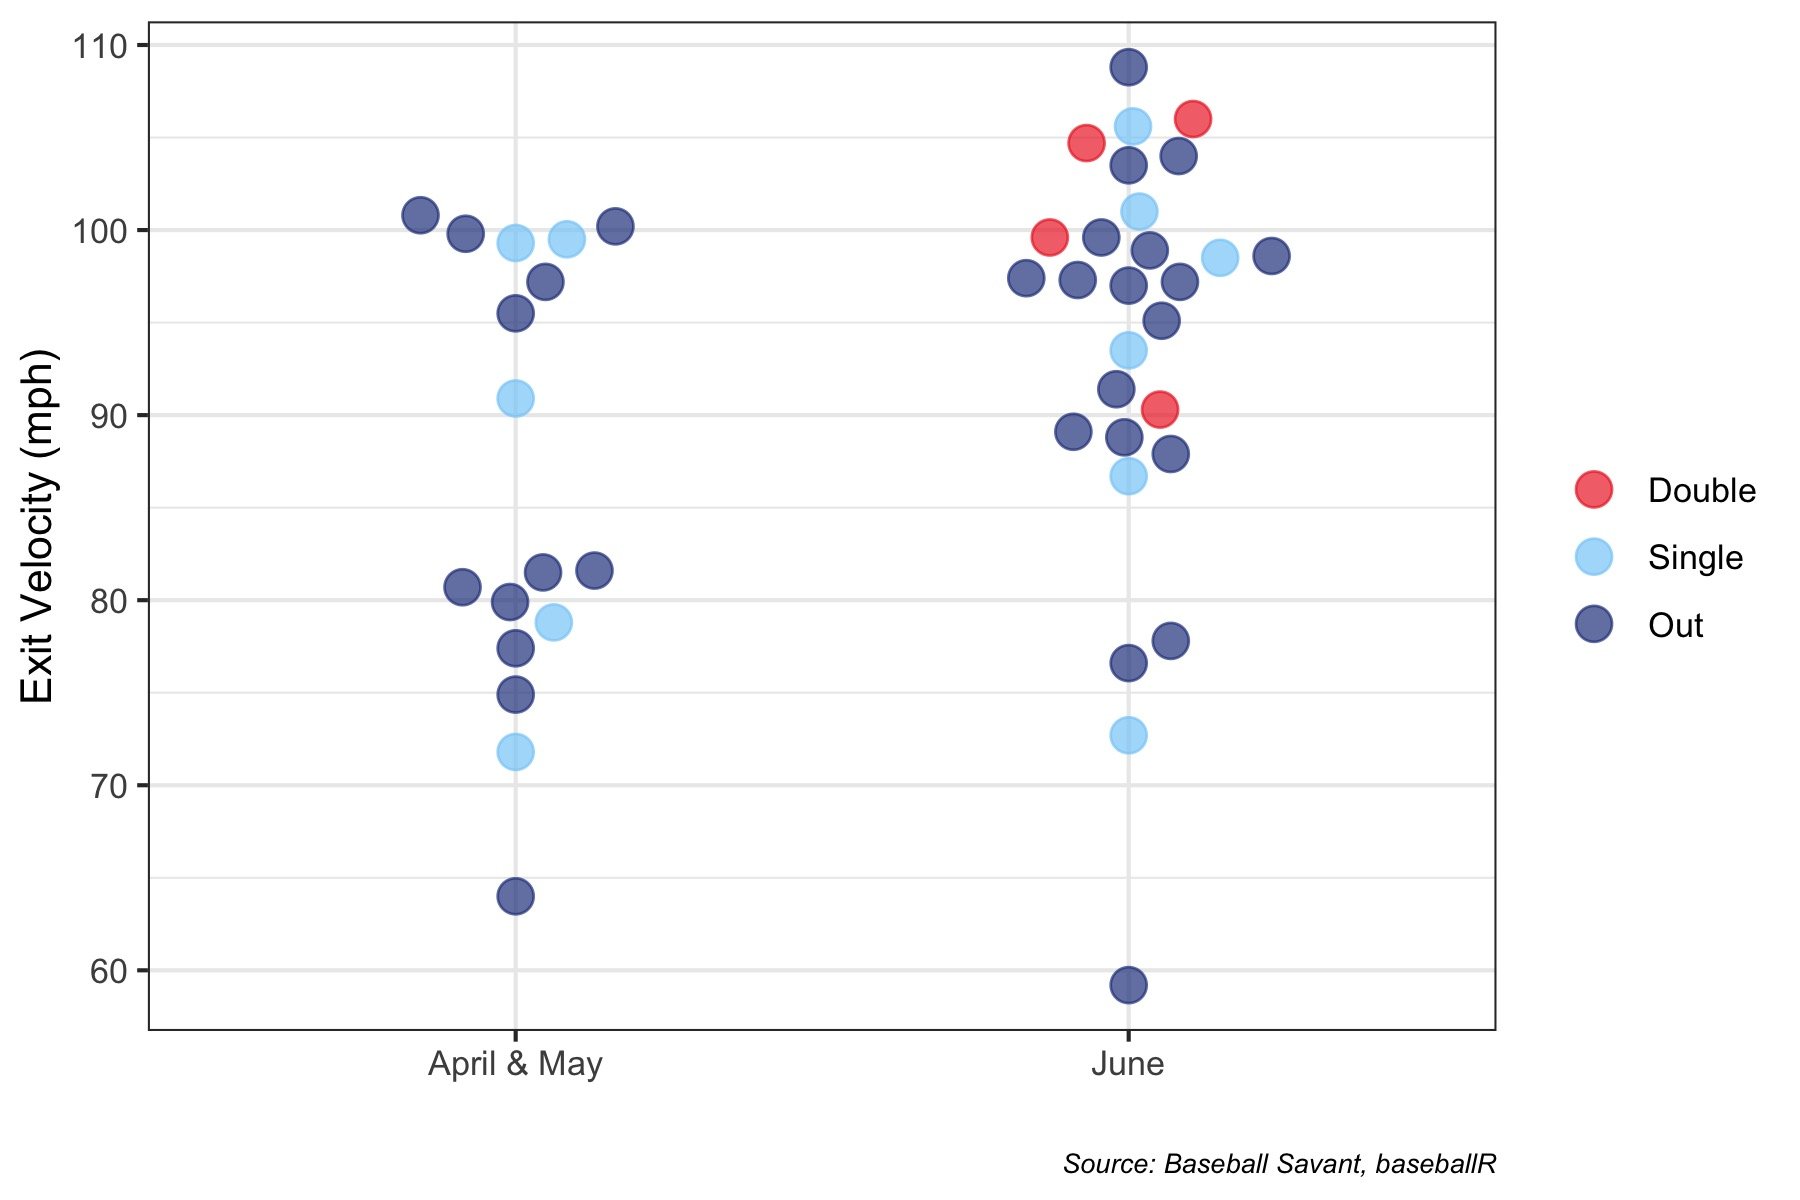 The above graph shows the exit velocity of each ball put into play by Alex Kirilloff, separated by stints in the majors. A few notes: Of the 45 balls in play this season, the seven hardest-hit balls have all been hit since returning to the lineup in June. Average exit velocity in April and May: 86.7 ... average exit velocity in June: 93.8. All four of his extra-base hits have come in June. With these new-and-improved exit velocities, the extra-base hits are only going to keep coming. Kirilloff's first home run of 2022 should also come sooner rather than later. As his season-long numbers continue to climb, Kirilloff's name ought to be in the lineup every day. Here's to continued wrist health.
 -
Twins Tidbit: Where have the Stolen Bases Gone?
TwinsData replied to TwinsData's topic in Twins Daily Front Page News
This is typically a bigger issue with something like a bar chart where a reader might infer something from the size of the bar. With a scatter plot, a reader should immediately jump to the axes to gauge the values at each point. But I take your point. There are tradeoffs in data visualization. -
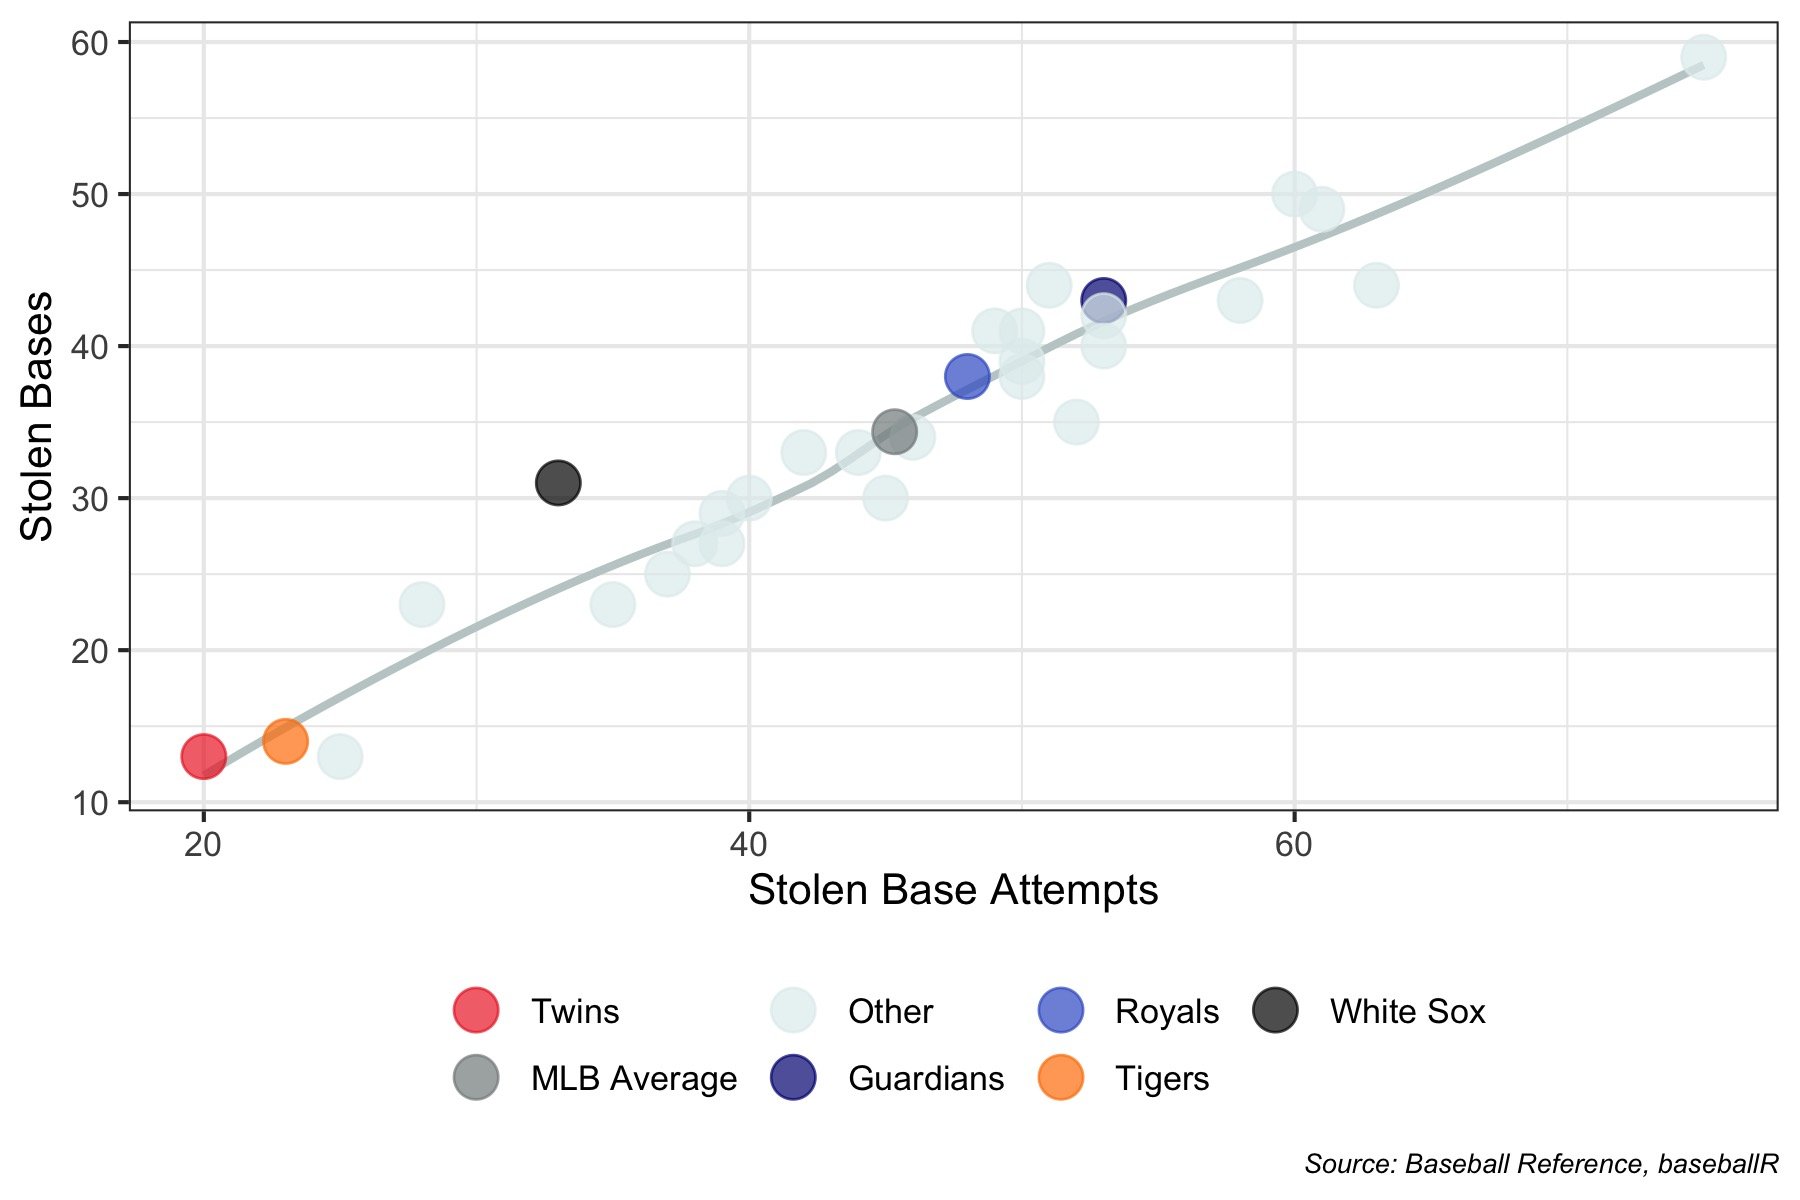 The above graph shows stolen base attempts and successfully stolen bases for each major league team along with the MLB average. A few notes: The Twins have the fewest stolen base attempts in the league with 20 and are tied for the fewest successful steals at 13. 76 percent of steal attempts have been successful in the league in 2022. The Twins, in their limited attempts, have been successful in 65 percent of attempts. The AL Central is not especially active on the base paths. Only the Royals and Guardians are more active than the average MLB team, and not by much. So how much meat are the Twins leaving on the bone by being the most conservative MLB team on the base paths? If they were as aggressive as the average base-stealing team, they would have attempted an additional 25 steals. At their current success rate, they would have taken 16 additional bases with the increased aggressiveness (and ran into 9 more outs!). Currently, the Twins are 7th in the majors in OPS at 0.733. Including walks, they have taken 1,160 bases offensively. Stolen bases are an exceedingly small fraction of any team's offensive output. If you added 16 bases to their Twins' output, their OPS would increase to 0.740, good enough for 6th in the majors. Is that worth the 9 additional outs from the additional runners who get caught?
 -
The Twins are the most conservative base stealers in the league. But does that imply they should be more aggressive on the base paths? The above graph shows stolen base attempts and successfully stolen bases for each major league team along with the MLB average. A few notes: The Twins have the fewest stolen base attempts in the league with 20 and are tied for the fewest successful steals at 13. 76 percent of steal attempts have been successful in the league in 2022. The Twins, in their limited attempts, have been successful in 65 percent of attempts. The AL Central is not especially active on the base paths. Only the Royals and Guardians are more active than the average MLB team, and not by much. So how much meat are the Twins leaving on the bone by being the most conservative MLB team on the base paths? If they were as aggressive as the average base-stealing team, they would have attempted an additional 25 steals. At their current success rate, they would have taken 16 additional bases with the increased aggressiveness (and ran into 9 more outs!). Currently, the Twins are 7th in the majors in OPS at 0.733. Including walks, they have taken 1,160 bases offensively. Stolen bases are an exceedingly small fraction of any team's offensive output. If you added 16 bases to their Twins' output, their OPS would increase to 0.740, good enough for 6th in the majors. Is that worth the 9 additional outs from the additional runners who get caught? View full article
-
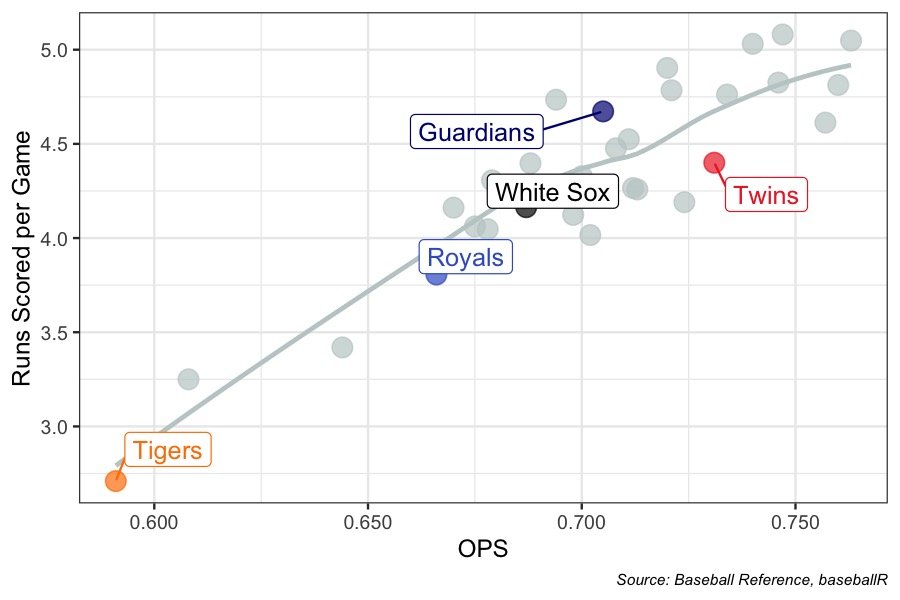 The chart above maps OPS and runs scored per game for each major league team. The trend line indicates (roughly) how many runs a team would be expected to score per game given its OPS. A point below the line indicates a team not scoring as many runs as they would be expected to: - The Twins have the 8th highest OPS in the majors but only score the 14th most runs per game. - Comparing their runs scored to the trend line, the Twins are scoring a fourth of a run per game (or one run every fourth game) less than they ought to. Why is this happening? Imagine a team that hits a leadoff double every inning and strands their runner on second every time. This team would have a 0.750 OPS and score zero runs per game even though a team with a 0.750 OPS would typically score 4.6 runs per game. Does this happen because they struggle with runners in scoring position? Or because they are getting unlucky in spacing out their hits? If those 9 doubles would occur consecutively, they would score 8 runs. If the former explanation seems more plausible, that’s bad news for the Twins. If the latter is more plausible, it’s time to buy stock in Twins run scoring (and sell off stock in the Guardians). (Um, can we get a wellness check on the Tigers?) For more Twins data, follow @TwinsData on Twitter. Duh.
 -
Should the offense be scoring more runs? The underlying statistics provide an answer. The chart above maps OPS and runs scored per game for each major league team. The trend line indicates (roughly) how many runs a team would be expected to score per game given its OPS. A point below the line indicates a team not scoring as many runs as they would be expected to: - The Twins have the 8th highest OPS in the majors but only score the 14th most runs per game. - Comparing their runs scored to the trend line, the Twins are scoring a fourth of a run per game (or one run every fourth game) less than they ought to. Why is this happening? Imagine a team that hits a leadoff double every inning and strands their runner on second every time. This team would have a 0.750 OPS and score zero runs per game even though a team with a 0.750 OPS would typically score 4.6 runs per game. Does this happen because they struggle with runners in scoring position? Or because they are getting unlucky in spacing out their hits? If those 9 doubles would occur consecutively, they would score 8 runs. If the former explanation seems more plausible, that’s bad news for the Twins. If the latter is more plausible, it’s time to buy stock in Twins run scoring (and sell off stock in the Guardians). (Um, can we get a wellness check on the Tigers?) For more Twins data, follow @TwinsData on Twitter. Duh. View full article
-
Turns out staying (relatively) healthy leads to increased production. Who knew? You know that Byron Buxton is having a great season. Do you know he’s having his (so far) greatest season? As you can see from the chart above: - The 28-year-old has more home runs through 48 games than any of his previous seasons. - His home run binge began in 2020 and has continued through 2021 and 2022. - He has already played in more games in 2022 than in 3 of his previous 7 seasons. There may be lots of room for debate in how his health and playing time is being handled. For instance, maybe trying a different path would work just as well or even better? But his performance this year, at least according to the early returns, is setting him up for a career year. [Knocking on wood furiously] View full article
-
 You know that Byron Buxton is having a great season. Do you know he’s having his (so far) greatest season? As you can see from the chart above: - The 28-year-old has more home runs through 48 games than any of his previous seasons. - His home run binge began in 2020 and has continued through 2021 and 2022. - He has already played in more games in 2022 than in 3 of his previous 7 seasons. There may be lots of room for debate in how his health and playing time is being handled. For instance, maybe trying a different path would work just as well or even better? But his performance this year, at least according to the early returns, is setting him up for a career year. [Knocking on wood furiously]


