
TwinsData
-
Posts
44 -
Joined
-
Last visited
Content Type
Profiles
News
Minnesota Twins Videos
2026 Minnesota Twins Top Prospects Ranking
2022 Minnesota Twins Draft Picks
Minnesota Twins Free Agent & Trade Rumors, Notes, & Tidbits
Guides & Resources
2023 Minnesota Twins Draft Picks
The Minnesota Twins Players Project
2024 Minnesota Twins Draft Picks
2025 Minnesota Twins Draft Pick Tracker
2026 Minnesota Twins Draft Tracker: Picks & Bonuses
Forums
Blogs
Events
Store
Downloads
Gallery
Everything posted by TwinsData
-
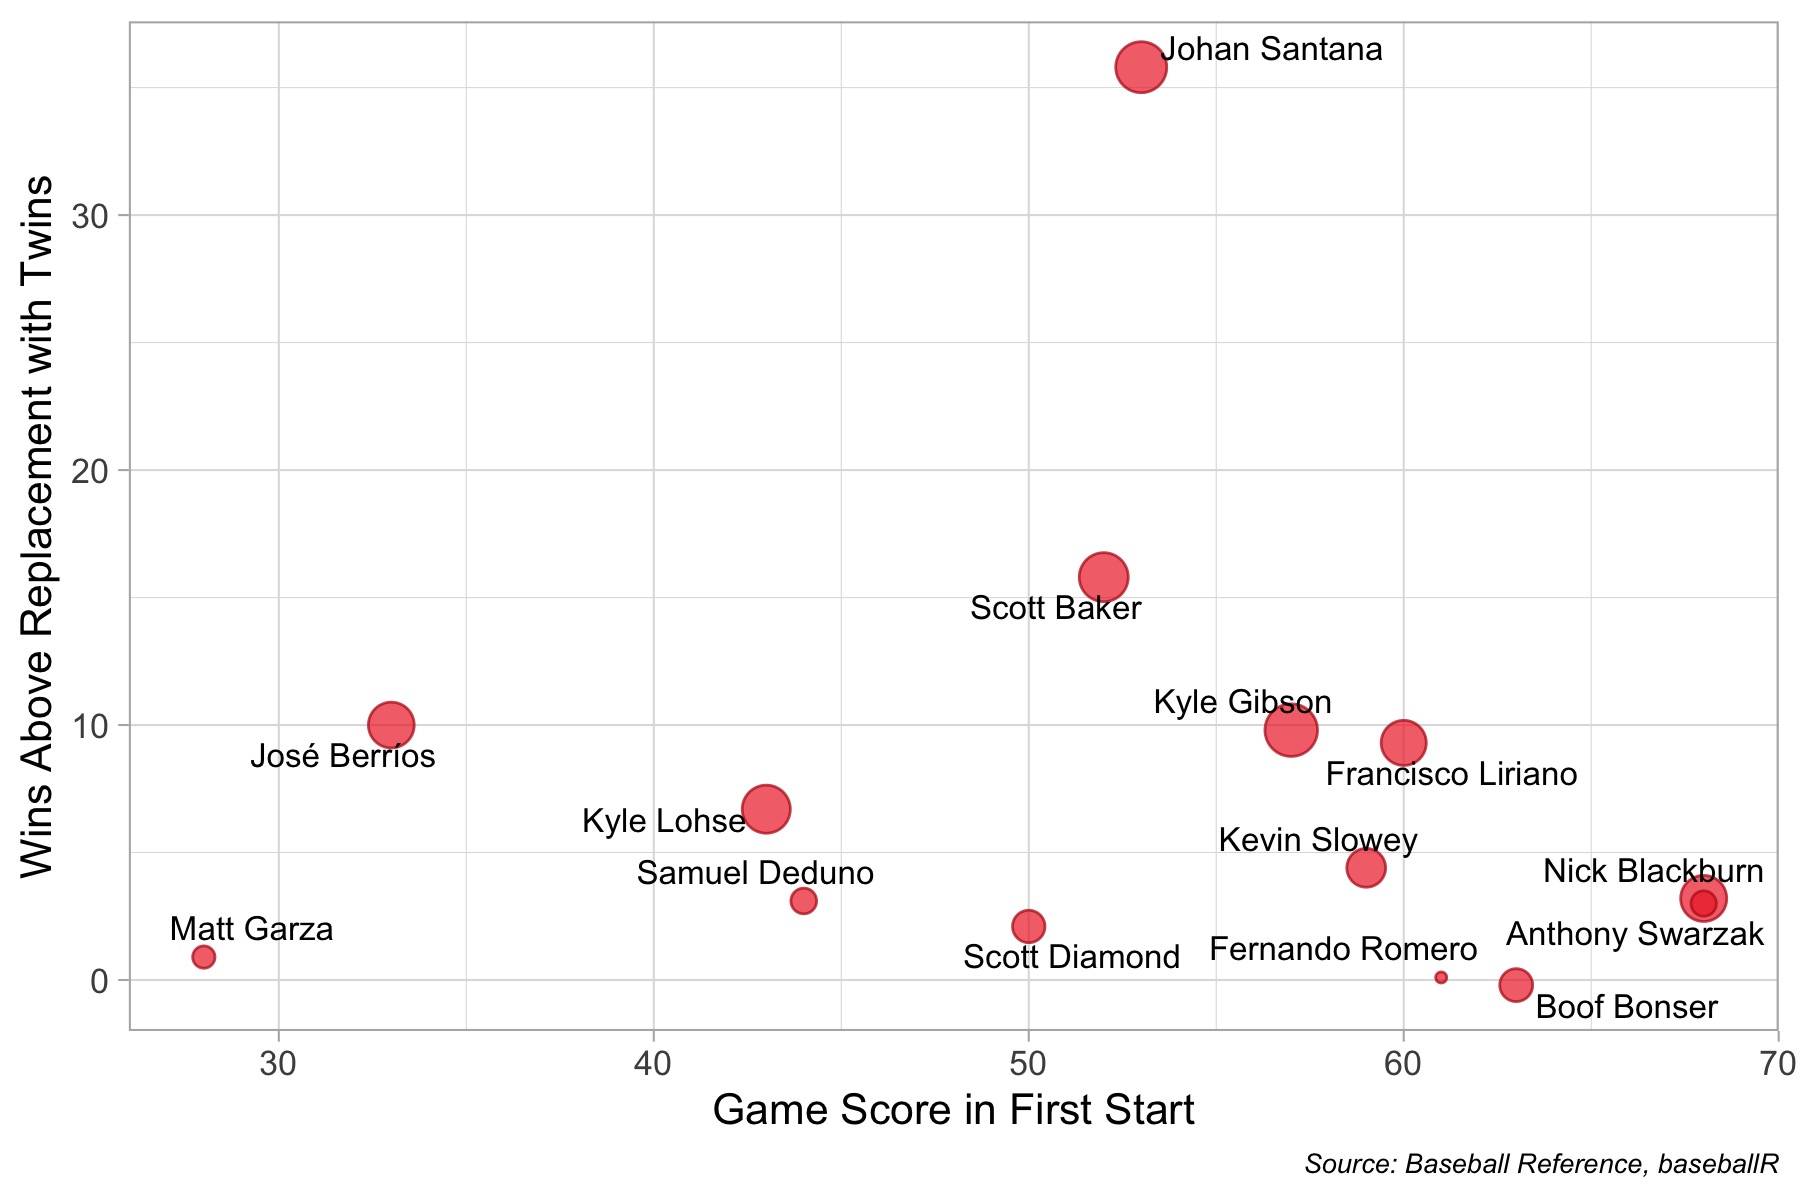 The above graph plots the effectiveness of a pitcher's first start (measured by game score) and their career wins above replacement with Minnesota for the notable Twins pitchers to make their first start since 2000. The size of the point corresponds to career starts in a Twins uniform. The figure only includes pitchers whose Twins career has finished and those who were primarily starters. A few things stand out: The pitchers with the most impressive first starts are not exactly Twins Hall-of-Famers. Nick Blackburn, Anthony Swarzak, Boof Bonser, and Fernando Romero are the only starters with initial game scores above 60. Jose Berrios, quite memorably, had one of the worst Twins debuts in recent memory. He turned out alright. Where would the 2022 debutants fit in the list of game scores? Josh Winder: 76 ... six shutout innings with a single walk against the Rays, topping the list Louie Varland: 60 ... a memorable debut at Yankee Stadium and one of the better debuts in the last 20 years Simeon Woods Richardson: 56 ... a better first start than Johan Santana, he's well on his way! Cole Sands: 36 ... one of the worst first starts in recent years, allowing four runs in four innings in Detroit The moral of the story? Don't get too high or too low on a pitcher's career after one start. Maybe even after one year. Randomness abounds!
- 4 comments
-
- 4
-

-
- simeon woods richardson
- louis varland
- (and 3 more)
-
 Simeon Woods Richardson, Josh Winder, Louie Varland, and Cole Sands all made their first starts in the big leagues in 2022 with a wide range of results. But do first starts predict future success at all? Let's take a look at recent Twins history. Image courtesy of TwinsData The above graph plots the effectiveness of a pitcher's first start (measured by game score) and their career wins above replacement with Minnesota for the notable Twins pitchers to make their first start since 2000. The size of the point corresponds to career starts in a Twins uniform. The figure only includes pitchers whose Twins career has finished and those who were primarily starters. A few things stand out: The pitchers with the most impressive first starts are not exactly Twins Hall-of-Famers. Nick Blackburn, Anthony Swarzak, Boof Bonser, and Fernando Romero are the only starters with initial game scores above 60. Jose Berrios, quite memorably, had one of the worst Twins debuts in recent memory. He turned out alright. Where would the 2022 debutants fit in the list of game scores? Josh Winder: 76 ... six shutout innings with a single walk against the Rays, topping the list Louie Varland: 60 ... a memorable debut at Yankee Stadium and one of the better debuts in the last 20 years Simeon Woods Richardson: 56 ... a better first start than Johan Santana, he's well on his way! Cole Sands: 36 ... one of the worst first starts in recent years, allowing four runs in four innings in Detroit The moral of the story? Don't get too high or too low on a pitcher's career after one start. Maybe even after one year. Randomness abounds! View full article
- 4 replies
-
- 2
-
-
- simeon woods richardson
- louis varland
- (and 3 more)
-
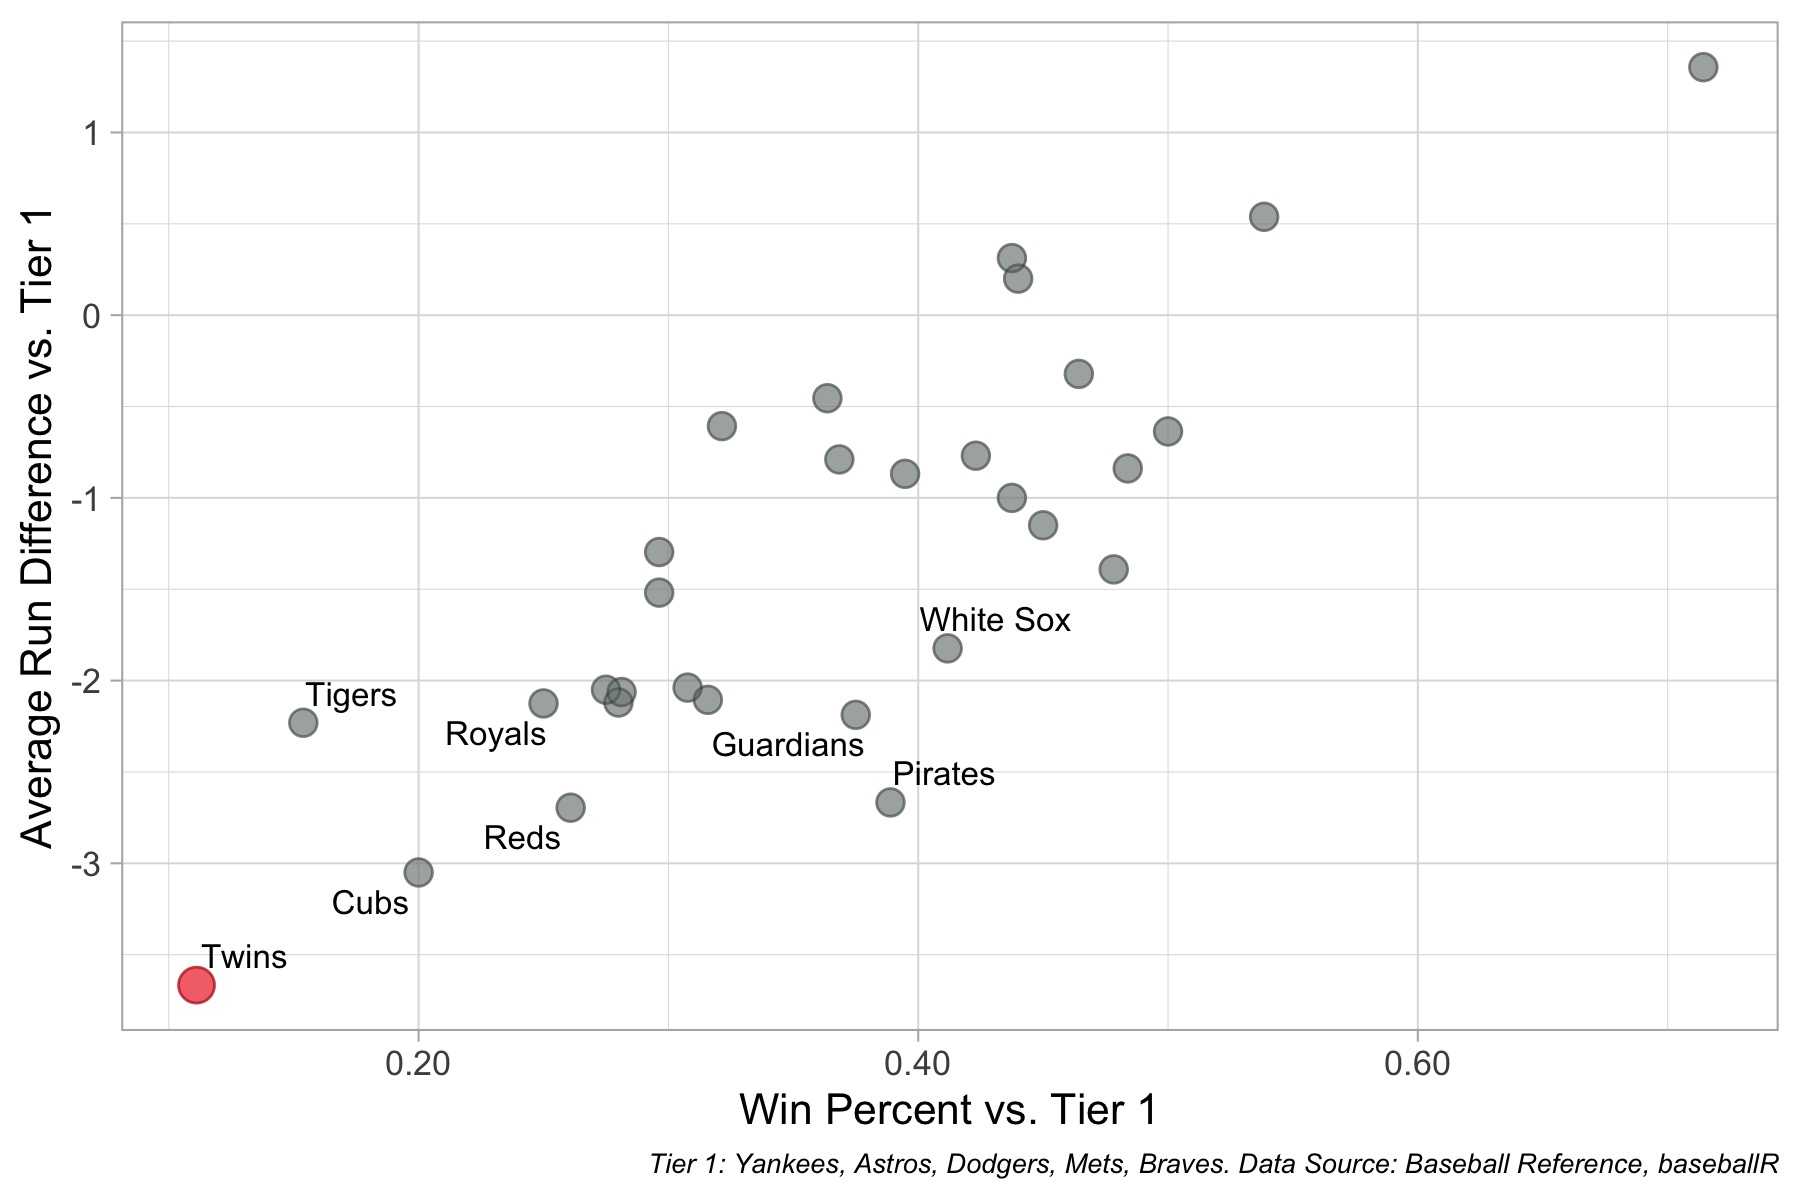 The above graph plots the results for every major league team against the five opponents currently on pace for more than 95 wins: Yankees, Astros, Dodgers, Braves, and Mets. The x-axis is win percentage in those games and the y-axis is run difference per game. A few notes: The Twins were far and away the worst team in the league against this set of teams with a 0.11 win percentage, going 2-16. Those losses were well-earned, with an average run difference of -3.67. In-division foes Detroit, Cleveland, Kansas City, and the White Sox will have played an almost identical schedule to the Twins, so comparisons between them are particularly appropriate. Even the lowly Tigers and gutted Royals have outperformed the Twins against the class of the league. The Twins' current deficit in the division can be attributed to their performance in these games. By contrast to the Twins' 2-16, the Guardians are a respectable 6-10 and the White Sox are 7-10. A similar performance from the hometown nine would have the Twins comfortably in first place in the AL Central. Luckily, none of the power five are divisional foes, so the Twins will still have a chance to squeak into the playoffs. We are all hoping for another shot at the Yankees or Astros in October. Right?
 -
There are five major league teams on pace 95 wins or more. Now that the Twins have wrapped up all their games against the power five, how did they fare? Really not good. Image courtesy of TwinsData The above graph plots the results for every major league team against the five opponents currently on pace for more than 95 wins: Yankees, Astros, Dodgers, Braves, and Mets. The x-axis is win percentage in those games and the y-axis is run difference per game. A few notes: The Twins were far and away the worst team in the league against this set of teams with a 0.11 win percentage, going 2-16. Those losses were well-earned, with an average run difference of -3.67. In-division foes Detroit, Cleveland, Kansas City, and the White Sox will have played an almost identical schedule to the Twins, so comparisons between them are particularly appropriate. Even the lowly Tigers and gutted Royals have outperformed the Twins against the class of the league. The Twins' current deficit in the division can be attributed to their performance in these games. By contrast to the Twins' 2-16, the Guardians are a respectable 6-10 and the White Sox are 7-10. A similar performance from the hometown nine would have the Twins comfortably in first place in the AL Central. Luckily, none of the power five are divisional foes, so the Twins will still have a chance to squeak into the playoffs. We are all hoping for another shot at the Yankees or Astros in October. Right? View full article
-
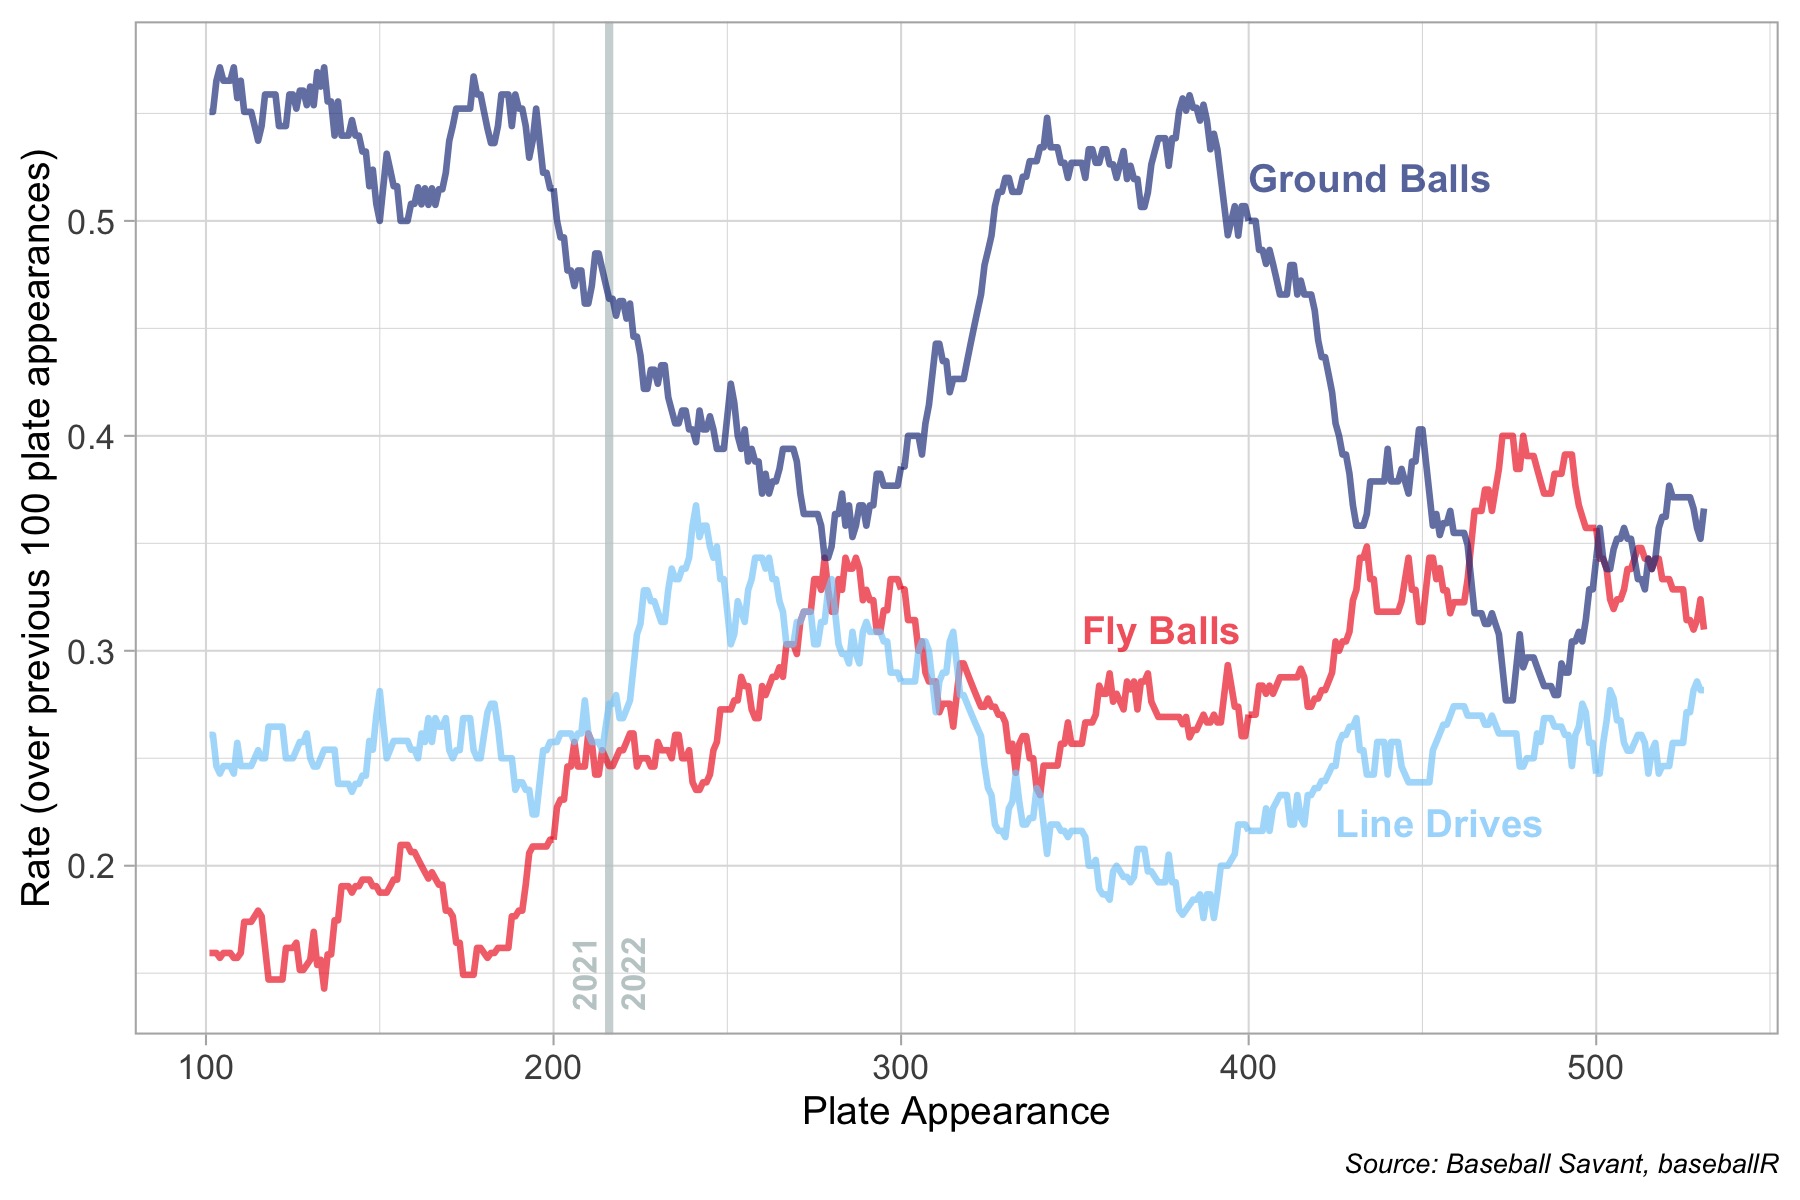 The above graph shows the percent of Gordon's hitting outcomes over the previous 100 plate appearances as his career as progressed. The point where the data cross from his 2021 season to his 2022 season is marked with a gray vertical line. Here are the key takeaways: Throughout his rookie season, Nick Gordon hit the ball on the ground. A lot. More than 50 percent of balls in play were ground balls and, for most of the season, less than 20 percent of balls were fly balls. The data show a small jump in fly balls and drop in ground balls toward the end of 2021, however. That was a sign of things to come. Gordon in 2022 is an entirely different hitter. He went through a stretch of ground-ball-heavy hitting in the early part of the season, but his groundball rate has plummeted. In his last 100 plate appearances, he's hit only 37 percent ground balls. His flyball rate is roughly 3 times higher in 2022 than 2021. The steady growth in this flyball rate is evident. Are fly balls good? Usually! It's difficult to get extra-base hits (and especially home runs, it turns out) when the ball is on the ground. An increase in fly balls is the reason his slugging percentage has jumped from 0.355 in 2021 to 0.431 in 2022. Given his slender frame, Nick Gordon looks like a slap-hitting utility man. And in 2021, that's mostly what he was. But through a drastic change in approach at the plate, Nick Gordon has transformed into a well-above-average hitter with a 116 OPS+. Maybe that lofty prospect status is starting to shine through.
 -
Nick Gordon entered his sophomore season in 2022 as a hopeful for a utility role. There were even days where he looked like a candidate to be designated for assignment in a roster crunch early in the season. Now he's planted himself firmly in the every day lineup while showing some power to all fields. Where did this come from? The above graph shows the percent of Gordon's hitting outcomes over the previous 100 plate appearances as his career as progressed. The point where the data cross from his 2021 season to his 2022 season is marked with a gray vertical line. Here are the key takeaways: Throughout his rookie season, Nick Gordon hit the ball on the ground. A lot. More than 50 percent of balls in play were ground balls and, for most of the season, less than 20 percent of balls were fly balls. The data show a small jump in fly balls and drop in ground balls toward the end of 2021, however. That was a sign of things to come. Gordon in 2022 is an entirely different hitter. He went through a stretch of ground-ball-heavy hitting in the early part of the season, but his groundball rate has plummeted. In his last 100 plate appearances, he's hit only 37 percent ground balls. His flyball rate is roughly 3 times higher in 2022 than 2021. The steady growth in this flyball rate is evident. Are fly balls good? Usually! It's difficult to get extra-base hits (and especially home runs, it turns out) when the ball is on the ground. An increase in fly balls is the reason his slugging percentage has jumped from 0.355 in 2021 to 0.431 in 2022. Given his slender frame, Nick Gordon looks like a slap-hitting utility man. And in 2021, that's mostly what he was. But through a drastic change in approach at the plate, Nick Gordon has transformed into a well-above-average hitter with a 116 OPS+. Maybe that lofty prospect status is starting to shine through. View full article
-
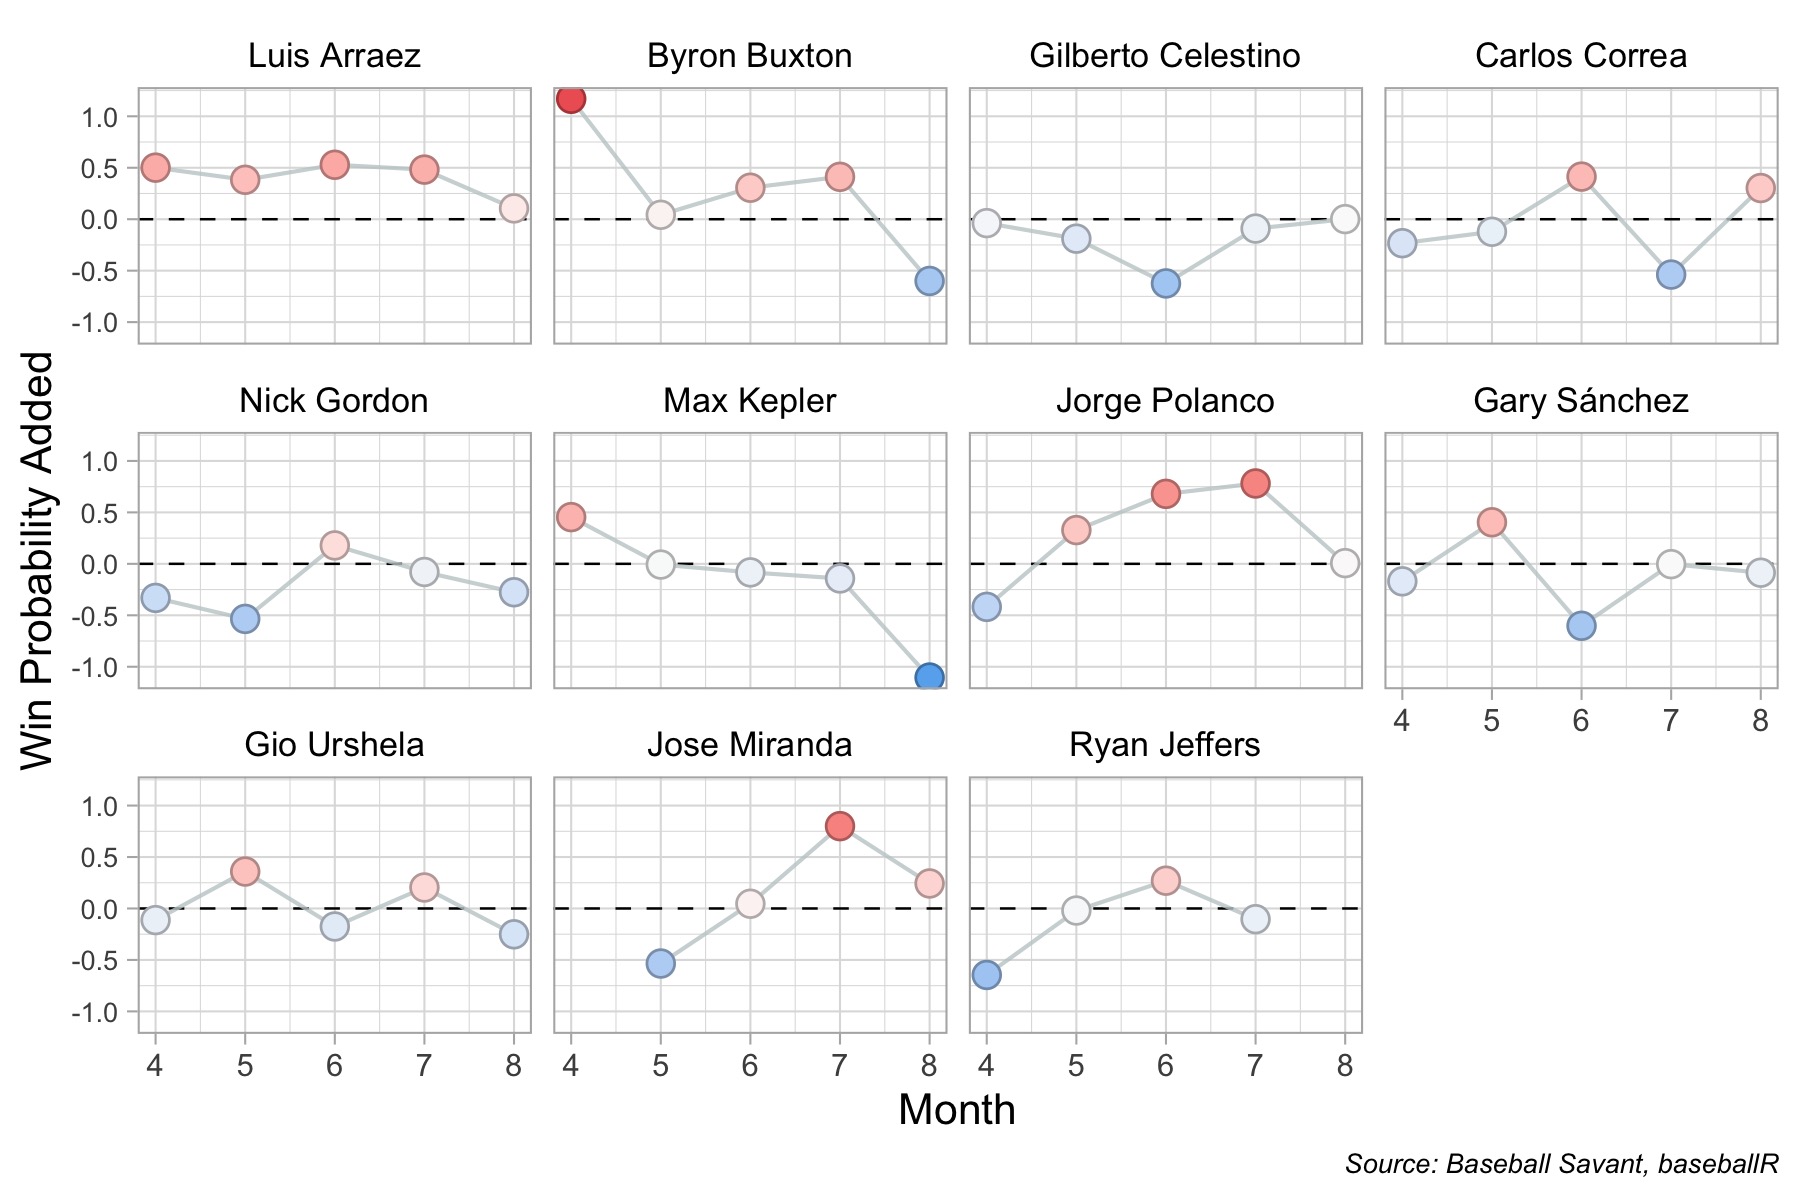 The above graph plots the win probability added by month for the Twins top 11 hitters in plate appearances. Because hitting with runners in scoring position and hitting in late-and-close situations is so crucial for winning games, the win probability measure is sensitive to performance in those situations. As a result, the graph reveals what we've all sensed: the lineup has stunk in August. Only three of these hitters have a significantly positive WPA thus far in August, meaning they helped more than they hurt the Twins chances of winning: Luis Arraez, Carlos Correa, and Jose Miranda. Only two of these hitters have a higher WPA in August than in July: Correa and Gilberto Celestino (barely). Byron Buxton and Max Kepler completely cratered in August. Injuries likely played a large part, but silver linings count for little in the standings. And for Kepler, a terrible August was the culmination of a season-long decline. Even Jorge Polanco and Arraez, who had each put up positive WPA's in the previous three and four months respectively, dipped to near zero impact in August. It can only go up from here, right? Right?
 -
The Twins lineup has seemingly gone ice cold in August. But who's to blame? And is this spell the result of a season-long decline or a fall off a cliff? Let's answer those questions by looking at month-to-month win probability added for the Twins top hitters. The above graph plots the win probability added by month for the Twins top 11 hitters in plate appearances. Because hitting with runners in scoring position and hitting in late-and-close situations is so crucial for winning games, the win probability measure is sensitive to performance in those situations. As a result, the graph reveals what we've all sensed: the lineup has stunk in August. Only three of these hitters have a significantly positive WPA thus far in August, meaning they helped more than they hurt the Twins chances of winning: Luis Arraez, Carlos Correa, and Jose Miranda. Only two of these hitters have a higher WPA in August than in July: Correa and Gilberto Celestino (barely). Byron Buxton and Max Kepler completely cratered in August. Injuries likely played a large part, but silver linings count for little in the standings. And for Kepler, a terrible August was the culmination of a season-long decline. Even Jorge Polanco and Arraez, who had each put up positive WPA's in the previous three and four months respectively, dipped to near zero impact in August. It can only go up from here, right? Right? View full article
- 4 replies
-
- 1
-

-
- byron buxton
- max kepler
- (and 3 more)
-
Twins Tidbit: Luis Arraez is a Unicorn
TwinsData replied to TwinsData's topic in Twins Daily Front Page News
You are in luck: -
Hitters face a tradeoff between swinging for power in order to drive the ball and protecting the plate with swings that are sure to make contact. The best hitters are the ones who effectively balance their swing-and-miss propensity with their aim to hit the ball hard. In his ability to do that, Luis Arraez is unique in all of baseball. The above graph plots the whiff rate (fraction of swings that are swings-and-misses) with average exit velocity for all MLB hitters in the top 10 percentile for whiff rate. A few takeaways: Among hitters with sufficient plate appearances, Arraez leads the league in whiff rate. Less than 7 percent of his swings result in misses. Only four hitters are even below 10 percent. (note that the plate appearance cutoff is not really driving this result ... the only hitters with lower whiff rates than Arraez have seen less than 40 pitches this season). Arraez's exit velocity is uniquely high for hitters with such low whiff rates. You have to get all the way to Michael Brantley to find a hitter who hits the ball harder than Arraez, and Brantley whiffs almost twice as often to accomplish that. Does exit velocity even matter? Of course. The league leaders in exit velocity are Yordan Alvarez, Aaron Judge, and Giancarlo Stanton. A real who's who. And the hitters who most closely resemble Arraez in whiff rate while sacrificing exit velocity (Steven Kwan, Luis Guillorme, and Nick Madrigal) own OPS values of 0.771, 0.712, and 0.581 compared to 0.841 for Arraez. No other hitter in the big leagues combines plate control and exit velocity like Arraez does. Imagine a Brantley or DJ LeMahieu who whiffed at pitches half as often without losing any of the power. And was only 25 years old. That's Arraez. Pretty good! View full article
-
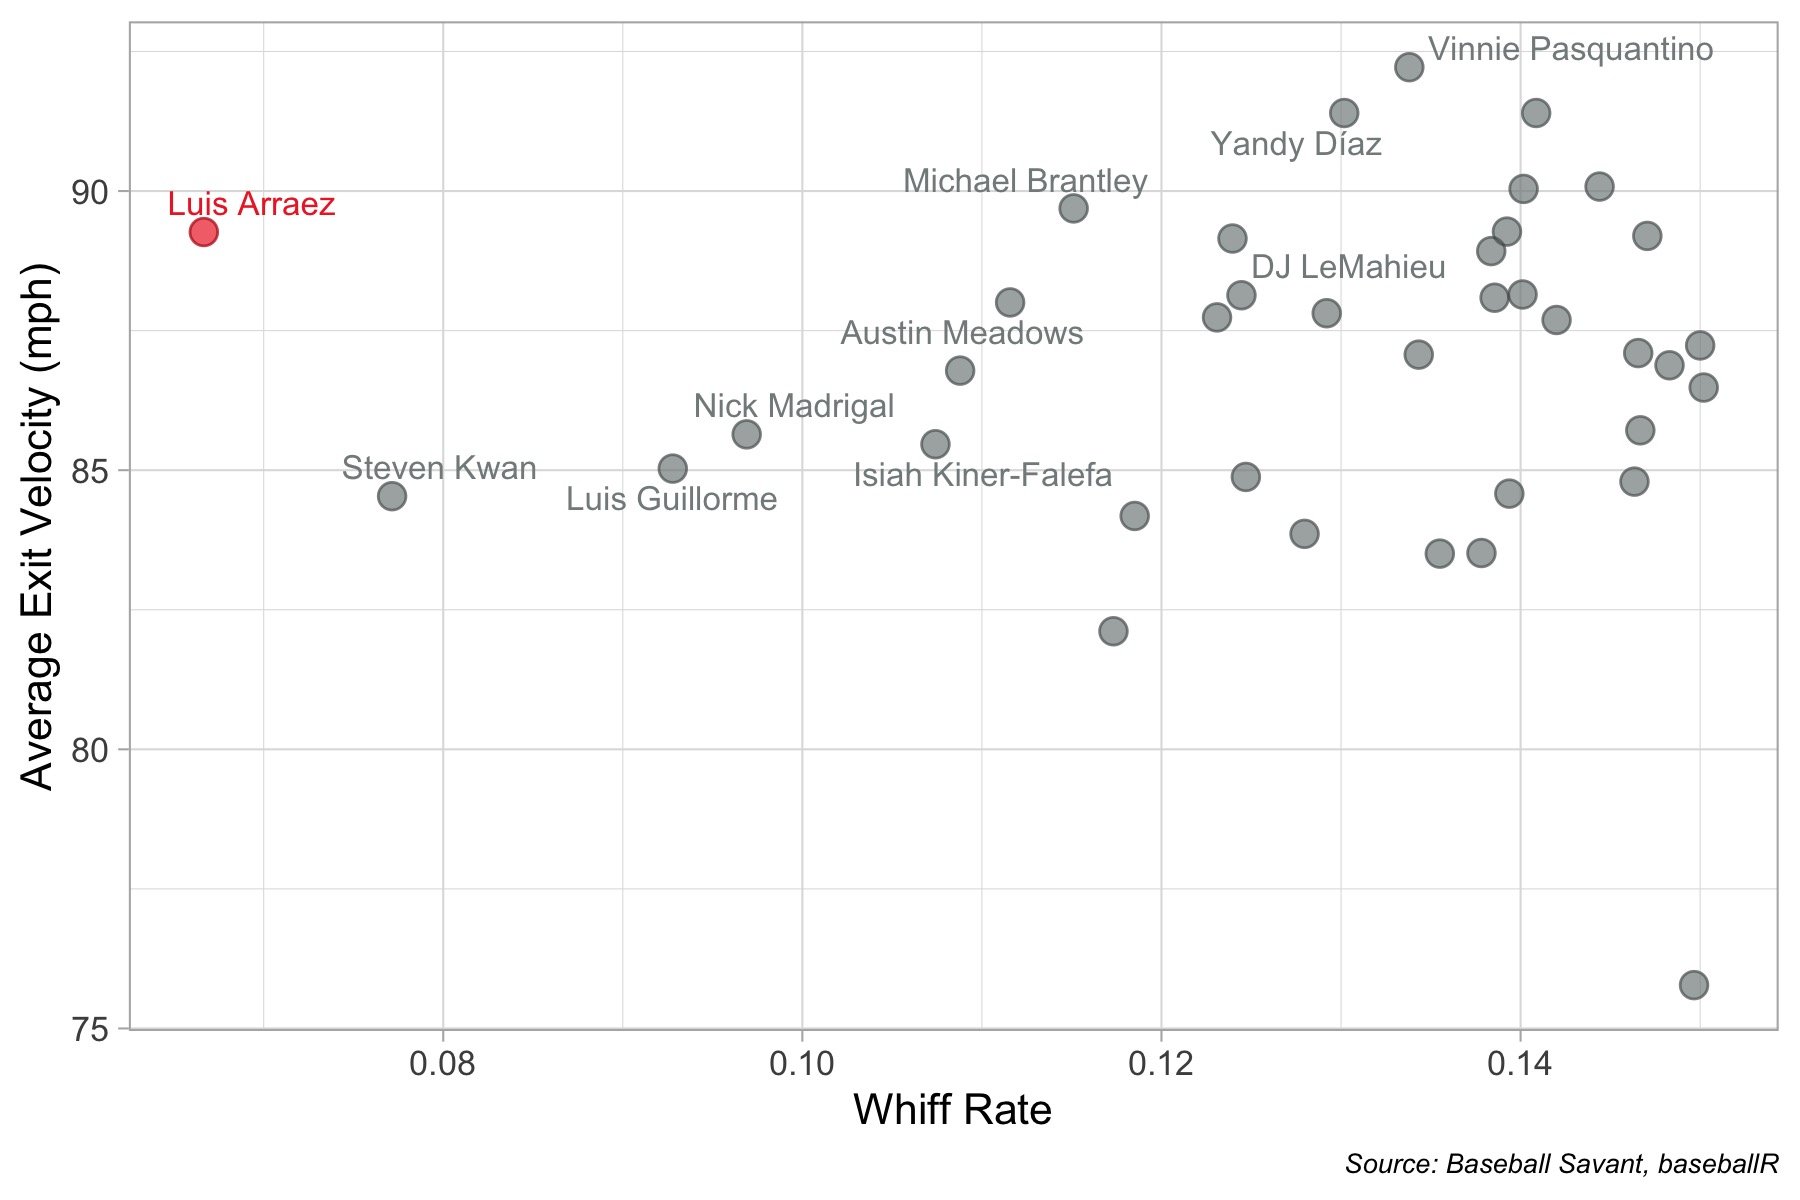 The above graph plots the whiff rate (fraction of swings that are swings-and-misses) with average exit velocity for all MLB hitters in the top 10 percentile for whiff rate. A few takeaways: Among hitters with sufficient plate appearances, Arraez leads the league in whiff rate. Less than 7 percent of his swings result in misses. Only four hitters are even below 10 percent. (note that the plate appearance cutoff is not really driving this result ... the only hitters with lower whiff rates than Arraez have seen less than 40 pitches this season). Arraez's exit velocity is uniquely high for hitters with such low whiff rates. You have to get all the way to Michael Brantley to find a hitter who hits the ball harder than Arraez, and Brantley whiffs almost twice as often to accomplish that. Does exit velocity even matter? Of course. The league leaders in exit velocity are Yordan Alvarez, Aaron Judge, and Giancarlo Stanton. A real who's who. And the hitters who most closely resemble Arraez in whiff rate while sacrificing exit velocity (Steven Kwan, Luis Guillorme, and Nick Madrigal) own OPS values of 0.771, 0.712, and 0.581 compared to 0.841 for Arraez. No other hitter in the big leagues combines plate control and exit velocity like Arraez does. Imagine a Brantley or DJ LeMahieu who whiffed at pitches half as often without losing any of the power. And was only 25 years old. That's Arraez. Pretty good!
 -
Creating favorable matchups is the key to successful bullpen management. Can we get our best southpaw lined up against their left-handed hitters? Which pitchers can be trusted to face both left- and right-handed hitters? Analyzing the platoon splits of each of the bullpen arms will help answer those questions. The graph above plots the platoon splits for each member of the Twins bullpen. OPS against vs. right-handed batters is on the x-axis, so points further to the left are successful against right-handed batters. OPS against vs. left-handed batters is on the y-axis, so points further toward the bottom are successful against left-handed batters. Points closest to the diagonal line are equally effective (or ineffective) against both types of batters. A few takeaways: Caleb Thielbar is on fire. Among relievers, he is at the 88th percentile for strikeout rate 98th percentile for exit velocity. Does that call for a promotion to a bigger role where he faces more right-handed batters? Perhaps. Right-handed batters own an OPS below 0.700 against Thielbar. In fact, his OPS against opposite-sided batters is better than that of Jorge López, who allows a 0.711 OPS to left-handed hitters. And nobody would call López a specialist against right-handed batters. The Twins deadline acquisitions, López and Fulmer, are death to righties allowing a 0.471 and 0.438 OPS respectively. Fulmer, however, is an absolute liability against lefties, allowing an 0.830 OPS to opposite-sided hitters. He meets the definition of a specialist. Emilio Pagan has insane reverse splits, with righties boasting a debilitating 1.075 OPS against. Pagán has never had significant reverse splits in prior seasons, so that may be an anomaly. But with the way things are going for Pagán, who's to say? Jhoan Duran, Trevor Megill, and Griffin Jax all appear to be matchup independent. And Megill's splits so closely mirroring Duran's suggest he deserves to keep getting chances View full article
-
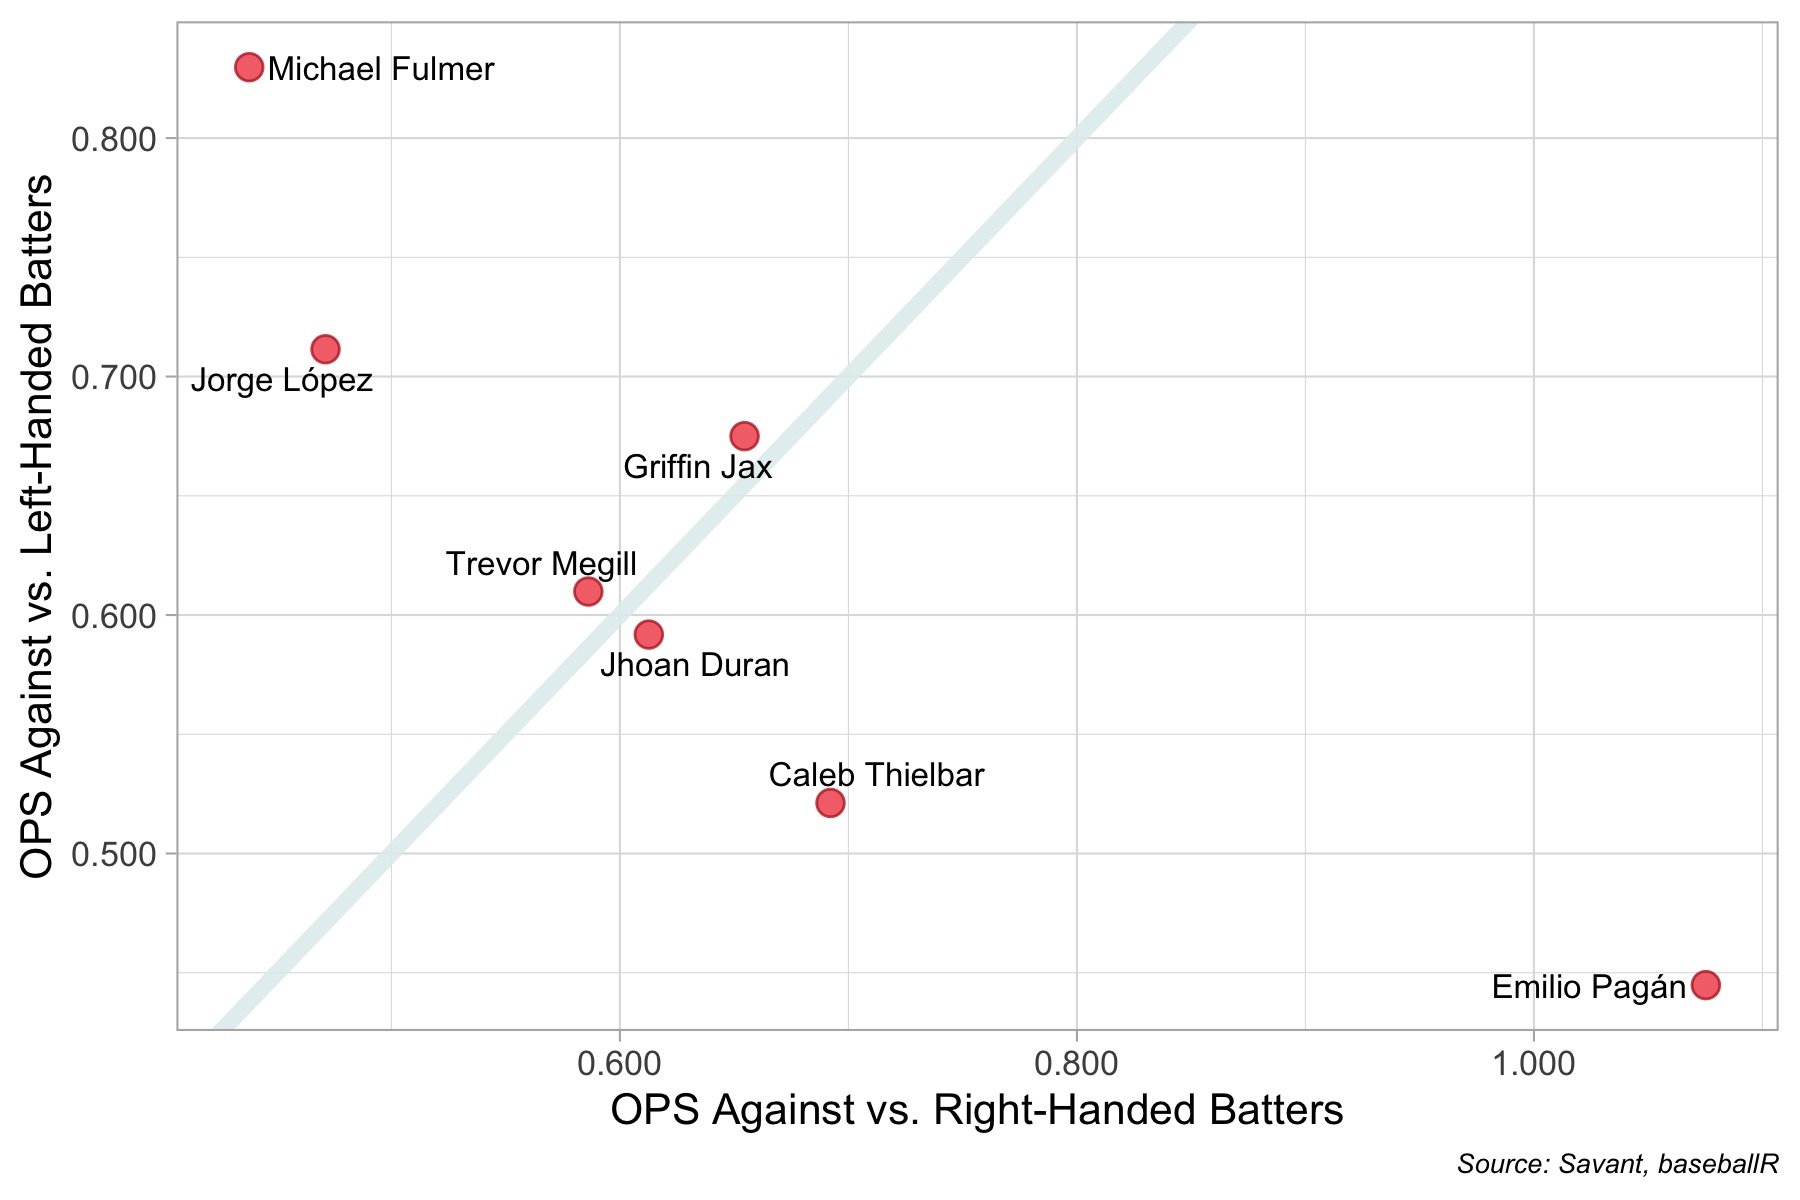 The graph above plots the platoon splits for each member of the Twins bullpen. OPS against vs. right-handed batters is on the x-axis, so points further to the left are successful against right-handed batters. OPS against vs. left-handed batters is on the y-axis, so points further toward the bottom are successful against left-handed batters. Points closest to the diagonal line are equally effective (or ineffective) against both types of batters. A few takeaways: Caleb Thielbar is on fire. Among relievers, he is at the 88th percentile for strikeout rate 98th percentile for exit velocity. Does that call for a promotion to a bigger role where he faces more right-handed batters? Perhaps. Right-handed batters own an OPS below 0.700 against Thielbar. In fact, his OPS against opposite-sided batters is better than that of Jorge López, who allows a 0.711 OPS to left-handed hitters. And nobody would call López a specialist against right-handed batters. The Twins deadline acquisitions, López and Fulmer, are death to righties allowing a 0.471 and 0.438 OPS respectively. Fulmer, however, is an absolute liability against lefties, allowing an 0.830 OPS to opposite-sided hitters. He meets the definition of a specialist. Emilio Pagan has insane reverse splits, with righties boasting a debilitating 1.075 OPS against. Pagán has never had significant reverse splits in prior seasons, so that may be an anomaly. But with the way things are going for Pagán, who's to say? Jhoan Duran, Trevor Megill, and Griffin Jax all appear to be matchup independent. And Megill's splits so closely mirroring Duran's suggest he deserves to keep getting chances
- 5 comments
-
- 7
-
-
- caleb thielbar
- michael fulmer
- (and 3 more)
-
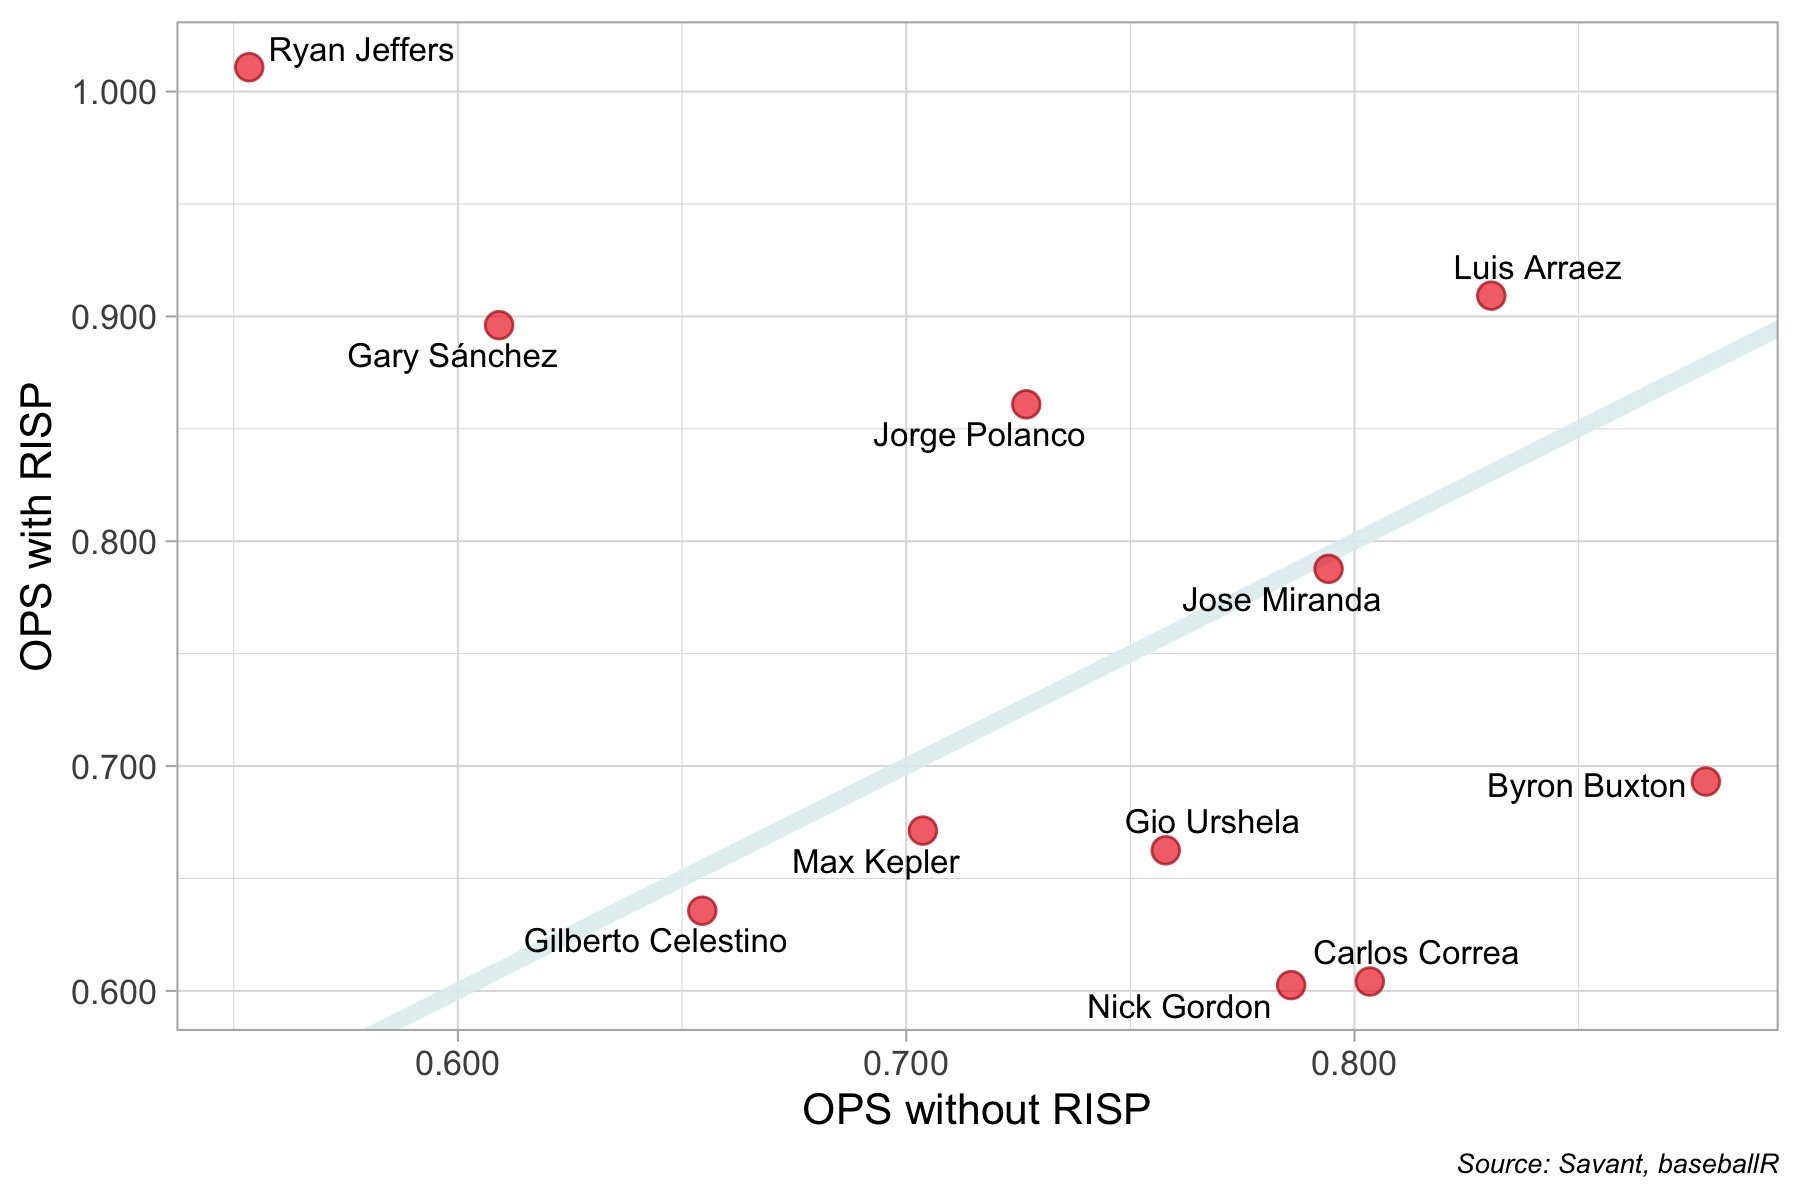 The above graph plots hitting performance with OPS (on-base + slugging percentage) without runners in scoring position on the x axis and with runners in scoring position on the y axis. A point on the gray diagonal line has equal performance with and without RISP. The further a point is vertically above the line, the better the hitter performs with RISP relative to their performance without. Those hitters are performing in important spots. The farther below the line, the more the hitter is coming up empty in big moments relative to their performance otherwise. A few things stand out: The Twins have 4 players who have hit significantly better with RISP and 4 who have hit significantly worse. As a team though, they hold a 0.723 OPS with RISP (#20 in MLB) and a 0.632 OPS with RISP and 2 outs (#28 in MLB). Ryan Jeffers has the team's most extreme splits. He owns a 0.553 OPS without RISP compared to a team-high 1.011 OPS with. Gary Sánchez has large splits as well. Carlos Correa deserves special mention. Without RISP, he's third among qualifying Twins with an 0.803 OPS. With RISP, only Nick Gordon has performed worse. Jorge Polanco has the most plate appearances with RISP on the Twins. Thankfully, he has come through with an 0.861 OPS in those crucial spots. Note that this analysis is best viewed as descriptive of past performance rather than predictive of future performance. A future tidbit will compare numbers with and without RISP in previous seasons to see if these splits carry over at all from year to year.
- 11 comments
-
- 5
-
-
- ryan jeffers
- gary sanchez
- (and 3 more)
-
A big part of run-scoring is hitting with runners in scoring position. Which hitters have been doing damage in big spots and which have been filling up on empty calories? The above graph plots hitting performance with OPS (on-base + slugging percentage) without runners in scoring position on the x axis and with runners in scoring position on the y axis. A point on the gray diagonal line has equal performance with and without RISP. The further a point is vertically above the line, the better the hitter performs with RISP relative to their performance without. Those hitters are performing in important spots. The farther below the line, the more the hitter is coming up empty in big moments relative to their performance otherwise. A few things stand out: The Twins have 4 players who have hit significantly better with RISP and 4 who have hit significantly worse. As a team though, they hold a 0.723 OPS with RISP (#20 in MLB) and a 0.632 OPS with RISP and 2 outs (#28 in MLB). Ryan Jeffers has the team's most extreme splits. He owns a 0.553 OPS without RISP compared to a team-high 1.011 OPS with. Gary Sánchez has large splits as well. Carlos Correa deserves special mention. Without RISP, he's third among qualifying Twins with an 0.803 OPS. With RISP, only Nick Gordon has performed worse. Jorge Polanco has the most plate appearances with RISP on the Twins. Thankfully, he has come through with an 0.861 OPS in those crucial spots. Note that this analysis is best viewed as descriptive of past performance rather than predictive of future performance. A future tidbit will compare numbers with and without RISP in previous seasons to see if these splits carry over at all from year to year. View full article
-
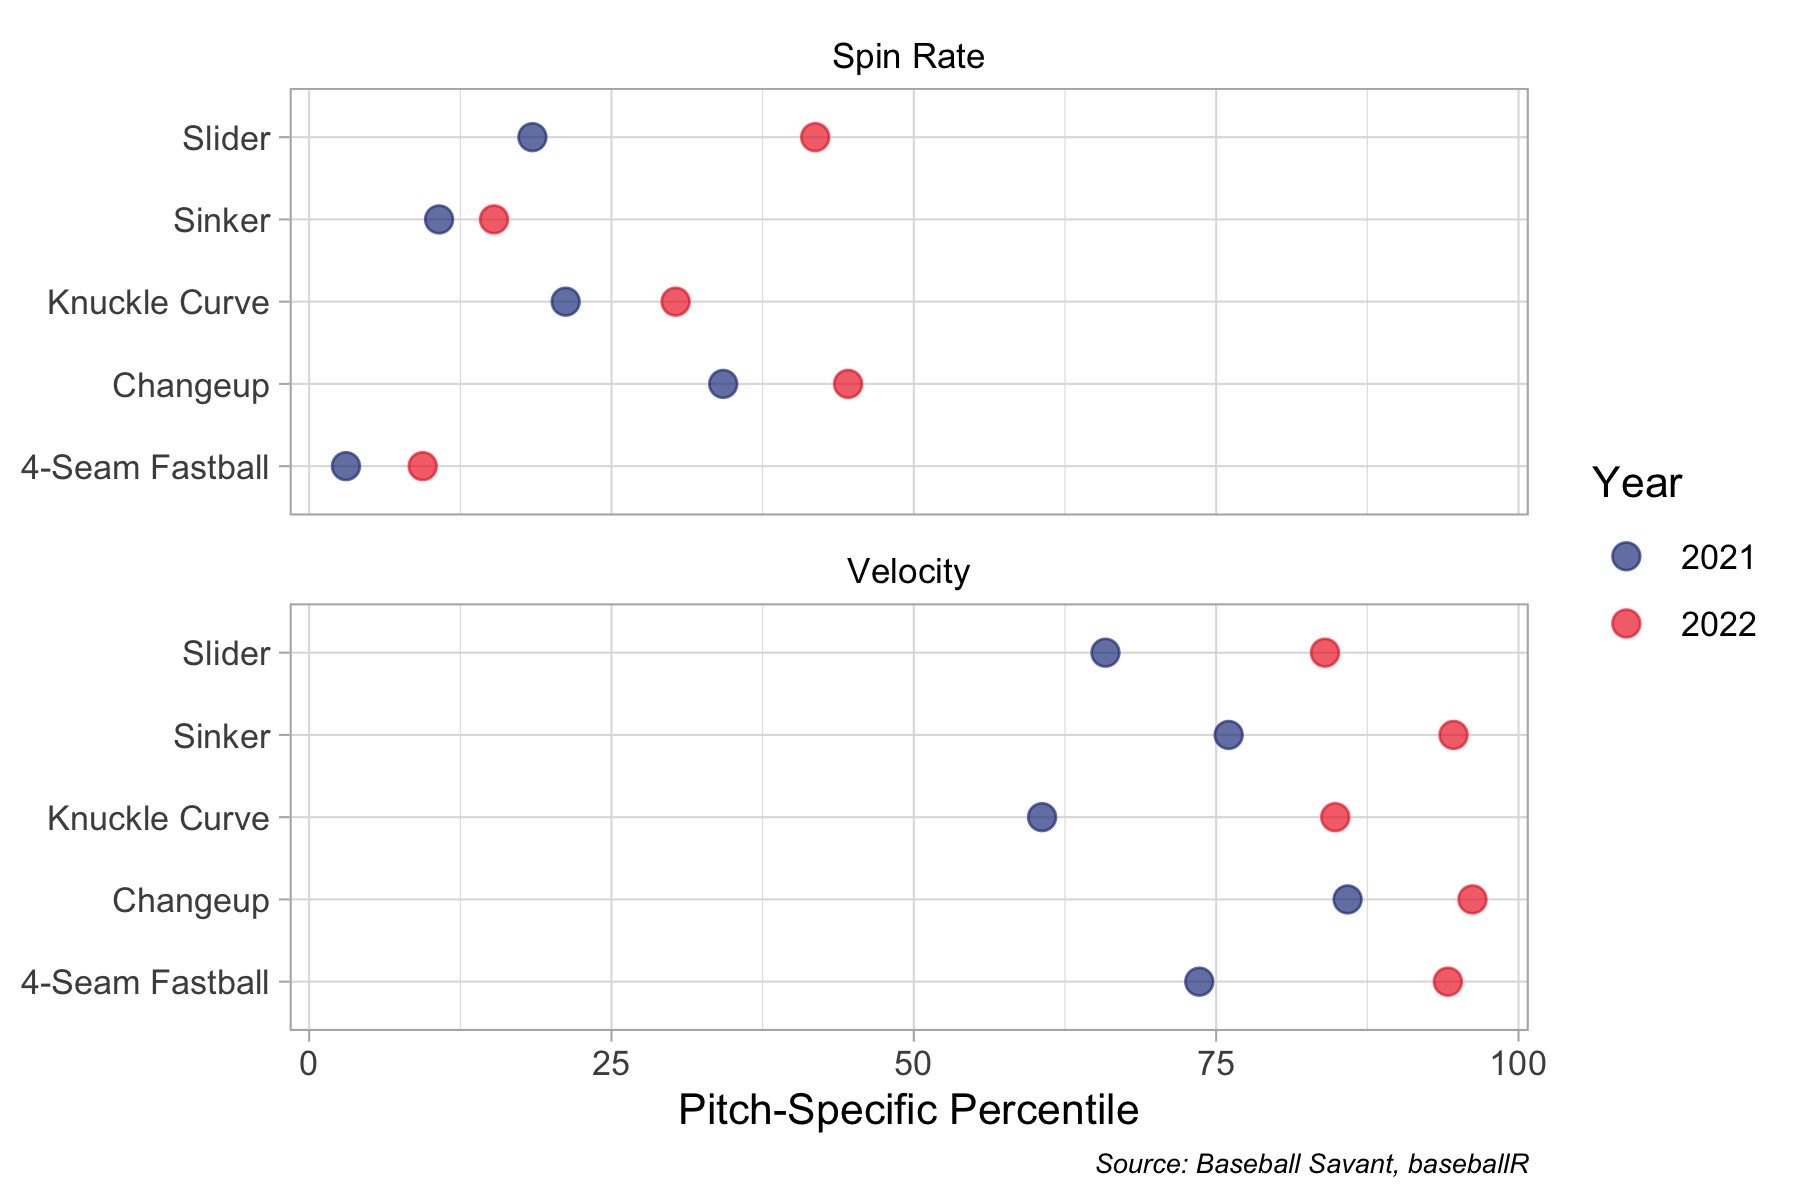 The above graph compares the average spin rate and average velocity of Lopez's five pitches to all other pitchers in 2022, with the pitch-specific percentile indicated by the point. So, for example, Lopez's sinker from 2021 would qualify as a 76th percentile sinker for average velocity. In other words, his 2021 sinker was thrown harder than 76 percent of sinkers. Upon his move to a full-time bullpen role, Jorge Lopez has added velocity and spin rate to all five of his pitches. His go-to pitch is the sinker and he now owns a 94th percentile sinker for velocity. In fact, all five of his pitches are now above the 84th percentile for velocity. Every one of his pitches gets on hitters quickly. On the other hand, none of his five pitches is above the 45th percentile for spin rate. Given that he will only ever see a hitter once in a game, it's enough to blow them away with velocity. Lopez's ability to get more out of each of his pitches and specialize in throwing the ball hard upon moving to the bullpen has transformed his career. The Twins are betting that adding Lopez to the mix will transform their bullpen.
 -
The Twins new bullpen addition, Jorge Lopez, has experienced a breakout season in 2022. He had a 6.04 career ERA with 7.6 K/9 innings entering 2022. But a full-time move to the bullpen in 2022 has seen his ERA drop to 1.68 with over 10 K/9 innings. The underlying numbers tell the story. The above graph compares the average spin rate and average velocity of Lopez's five pitches to all other pitchers in 2022, with the pitch-specific percentile indicated by the point. So, for example, Lopez's sinker from 2021 would qualify as a 76th percentile sinker for average velocity. In other words, his 2021 sinker was thrown harder than 76 percent of sinkers. Upon his move to a full-time bullpen role, Jorge Lopez has added velocity and spin rate to all five of his pitches. His go-to pitch is the sinker and he now owns a 94th percentile sinker for velocity. In fact, all five of his pitches are now above the 84th percentile for velocity. Every one of his pitches gets on hitters quickly. On the other hand, none of his five pitches is above the 45th percentile for spin rate. Given that he will only ever see a hitter once in a game, it's enough to blow them away with velocity. Lopez's ability to get more out of each of his pitches and specialize in throwing the ball hard upon moving to the bullpen has transformed his career. The Twins are betting that adding Lopez to the mix will transform their bullpen. View full article
-
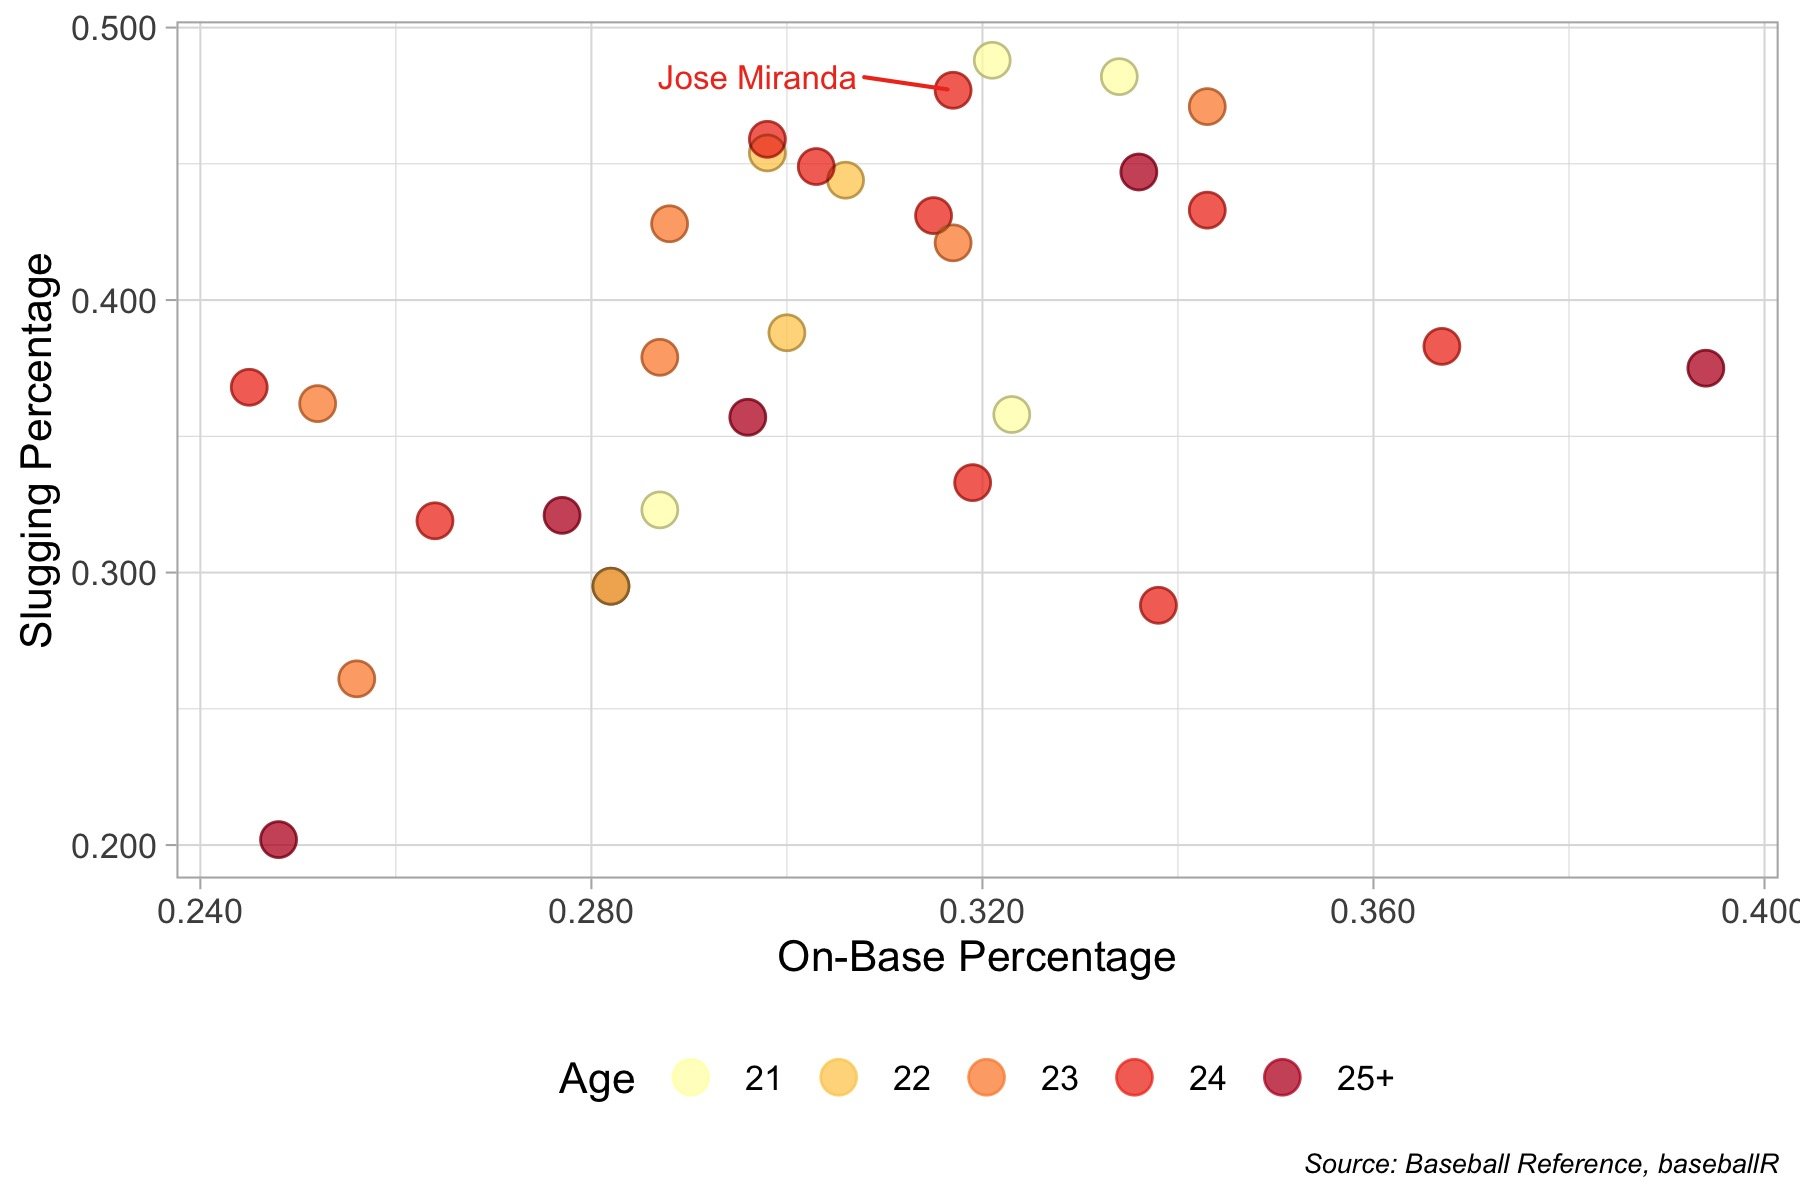 There are 30 rookie hitters who debuted in 2022 and have at least 100 plate appearances under their belts. The above graph plots their on-base percentages and slugging percentages, with Miranda indicated. Miranda is 3rd in slugging percentage at 0.477. Given that he is on the older side of this group, one may wonder if his success relative to other rookies is a product of having extra time to develop. But he's out-slugging all the rookies in his age 24 cohort. Only Mariners phenom Julio Rodriguez and Atlanta upstart Michael Harris, both in their age 21 seasons, have higher slugging percentages. Among Twins hitters with sufficient plate appearances, only Nick Gordon and Alex Kirilloff swing at a higher percentage of pitches in the strike zone than Miranda. At the same time, only Gordon, Gary Sánchez, and Gio Urshela swing at more pitches outside the strike zone than Miranda. Given his aggressiveness at the plate, Miranda's 0.317 on-base percentage (11th out of 30 qualifying rookies) is promising. If Miranda puts together two more months with production that resembles his July production, he may just put himself in the conversation for AL Rookie of the Year.
 -
Jose Miranda has quickly developed into one of the Twins most formidable hitters. But given his struggles early in the season, how do his overall numbers compare with other rookie hitters who debuted in 2022? There are 30 rookie hitters who debuted in 2022 and have at least 100 plate appearances under their belts. The above graph plots their on-base percentages and slugging percentages, with Miranda indicated. Miranda is 3rd in slugging percentage at 0.477. Given that he is on the older side of this group, one may wonder if his success relative to other rookies is a product of having extra time to develop. But he's out-slugging all the rookies in his age 24 cohort. Only Mariners phenom Julio Rodriguez and Atlanta upstart Michael Harris, both in their age 21 seasons, have higher slugging percentages. Among Twins hitters with sufficient plate appearances, only Nick Gordon and Alex Kirilloff swing at a higher percentage of pitches in the strike zone than Miranda. At the same time, only Gordon, Gary Sánchez, and Gio Urshela swing at more pitches outside the strike zone than Miranda. Given his aggressiveness at the plate, Miranda's 0.317 on-base percentage (11th out of 30 qualifying rookies) is promising. If Miranda puts together two more months with production that resembles his July production, he may just put himself in the conversation for AL Rookie of the Year. View full article
-
Twins Tidbit: Offensive Stock Report
TwinsData replied to TwinsData's topic in Twins Daily Front Page News
Correct. The dashed line is league average OPS. Those periods are removed from the data for Kirilloff. He had 18 plate appearances in April, then was out for 3 weeks, then had 14 plate appearances in May, then was out for 5 weeks. To include periods like that in the graphs would be distracting and misleading both for sample size reasons and the fact that there is no continuous stretch of play to actually measure a trend.- 13 replies
-
- 4
-
-
- jose miranda
- ryan jeffers
- (and 2 more)
-
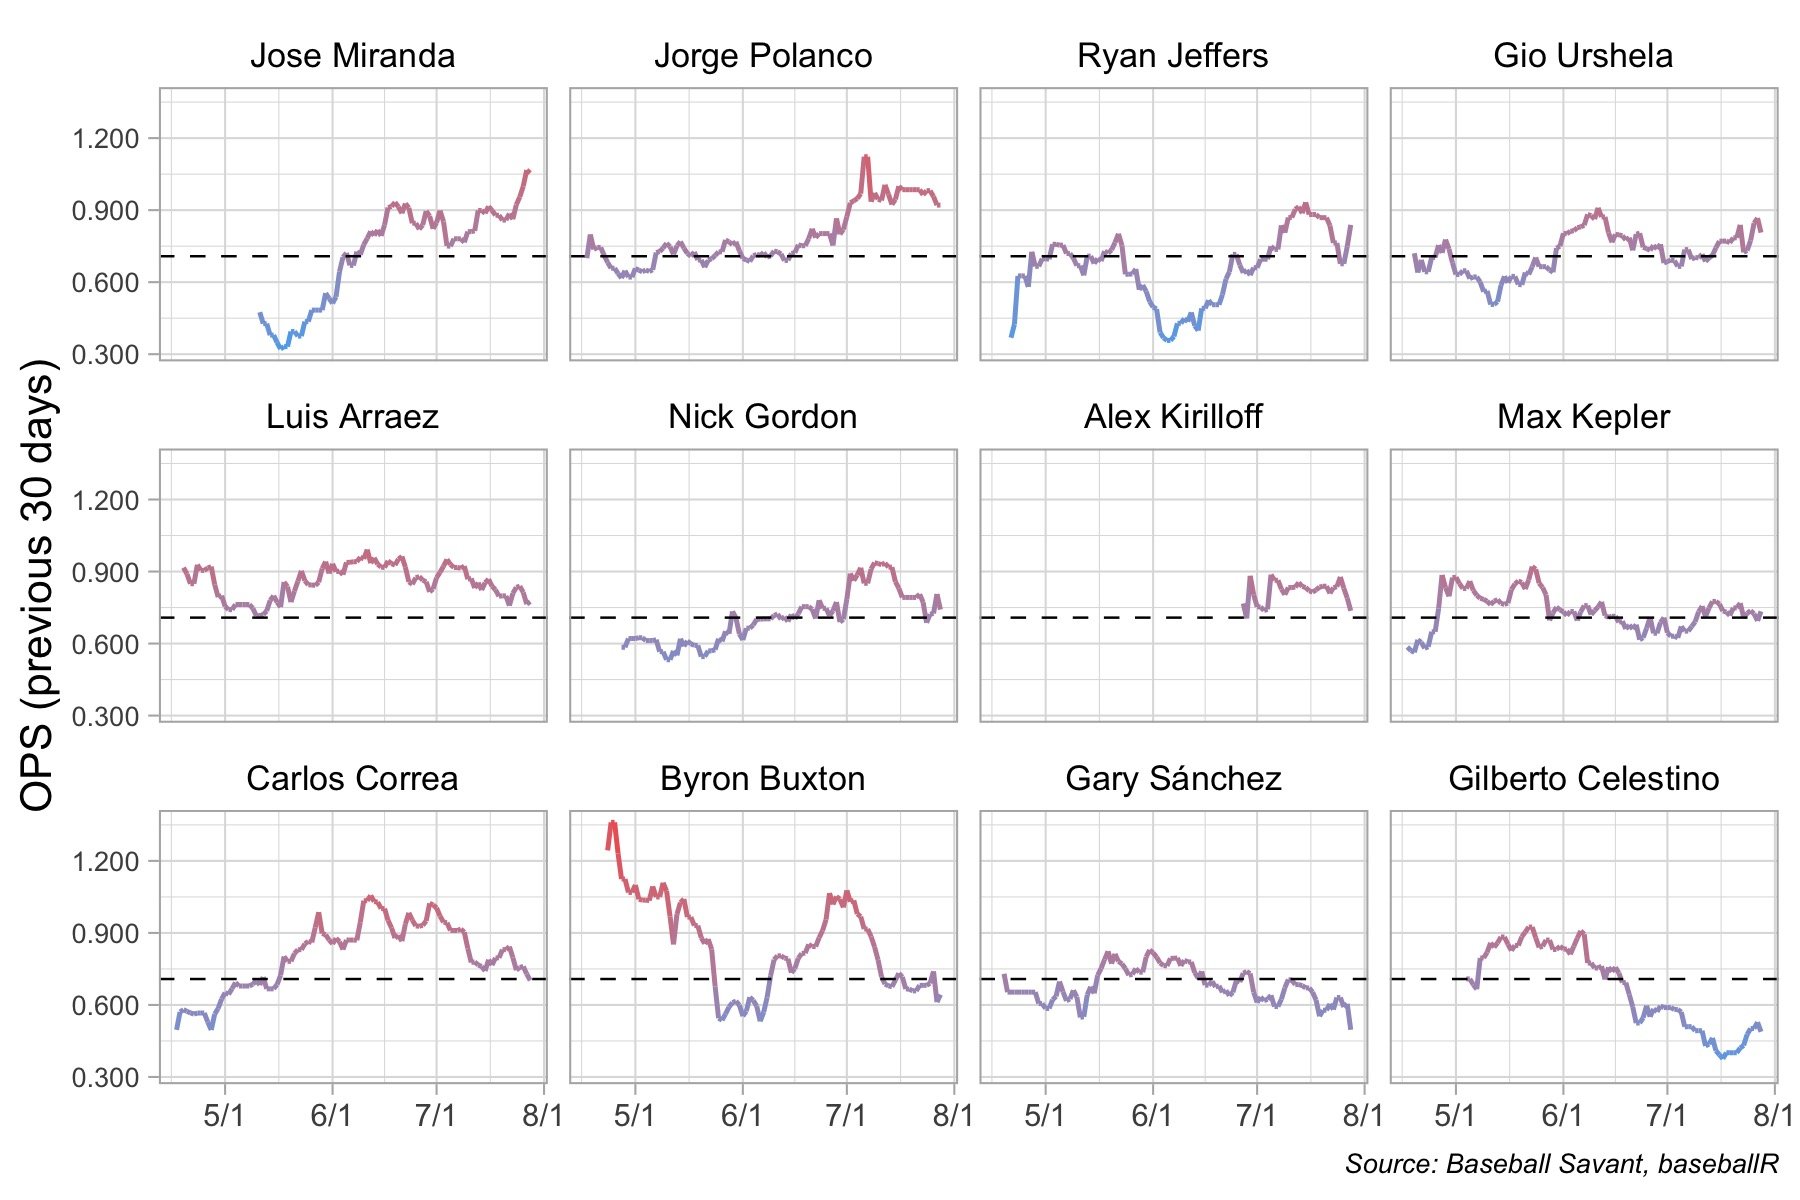 The above graph shows rolling OPS (on-base plus slugging percentage) over the past 30 days for each hitter with a sufficient number of plate appearances in the last month. For example, the height of the line at 7/1 indicates the hitter's OPS in the month of June. Hitters are sorted by their current OPS in the last month from left to right and then top to bottom. The dashed line indicates the MLB-average OPS of 0.708. Some takeaways: Jose Miranda is the hottest hitter in the Twins lineup with a 1.054 OPS in the last 30 days, capping off a meteoric rise. On May 15, his rolling OPS was a paltry 0.322. Stock way up. Jorge Polanco is similarly on fire. His rolling OPS has been above 0.900 for almost the entire month of July. Ryan Jeffers' injury is a shame. He had really started to heat up. At the same time, Gary Sánchez has been in a steady decline since June began. The consistent performance of Luis Arraez is remarkable. He has yet to have a 30-day stretch with a below-average OPS. By contrast, Byron Buxton is the most volatile hitter in the lineup with 30-day stretches of both 1.360 and 0.532 OPS. An underreported part of the Twins' forgettable July has been the cooling of Buxton (0.643 OPS in the last 30 days) and Carlos Correa (0.702). Miranda and Polanco were a band-aid over a struggling top of the lineup. It was past time for Gilberto Celestino to return to Triple-A. He owns a 0.488 OPS in the last 30 days and had been trending in that direction for some time. What else can we take away from the hitting trends that might help the Twins construct a winning lineup down the stretch?
- 13 comments
-
- 8
-
-
- jose miranda
- ryan jeffers
- (and 2 more)
-
As we move in August, which Twins hitters are heating up and solidifying their place in the every day lineup? Which are cooling off and casting doubt as to their role going forward? Let's take a look at the trends to determine which stocks to buy and which to sell. The above graph shows rolling OPS (on-base plus slugging percentage) over the past 30 days for each hitter with a sufficient number of plate appearances in the last month. For example, the height of the line at 7/1 indicates the hitter's OPS in the month of June. Hitters are sorted by their current OPS in the last month from left to right and then top to bottom. The dashed line indicates the MLB-average OPS of 0.708. Some takeaways: Jose Miranda is the hottest hitter in the Twins lineup with a 1.054 OPS in the last 30 days, capping off a meteoric rise. On May 15, his rolling OPS was a paltry 0.322. Stock way up. Jorge Polanco is similarly on fire. His rolling OPS has been above 0.900 for almost the entire month of July. Ryan Jeffers' injury is a shame. He had really started to heat up. At the same time, Gary Sánchez has been in a steady decline since June began. The consistent performance of Luis Arraez is remarkable. He has yet to have a 30-day stretch with a below-average OPS. By contrast, Byron Buxton is the most volatile hitter in the lineup with 30-day stretches of both 1.360 and 0.532 OPS. An underreported part of the Twins' forgettable July has been the cooling of Buxton (0.643 OPS in the last 30 days) and Carlos Correa (0.702). Miranda and Polanco were a band-aid over a struggling top of the lineup. It was past time for Gilberto Celestino to return to Triple-A. He owns a 0.488 OPS in the last 30 days and had been trending in that direction for some time. What else can we take away from the hitting trends that might help the Twins construct a winning lineup down the stretch? View full article
-
Twins Tidbit: Where are the Missing Runs?
TwinsData replied to TwinsData's topic in Twins Daily Front Page News
Great questions about statistical significance. Significance testing would go something like this. Suppose the Twins converted OPS to runs just like every other team (the gray line). How unlikely is it to produce the patterns given in red in the 96-game sample? And the statistical answer will be that it's not too unlikely. 96 games just isn't enough to separate signal from noise. 162 probably would not be either, so if statistical testing is the bar to clear to identify teams doing a bad job turning OPS into runs, we'll simply never identify one even if they exist. -
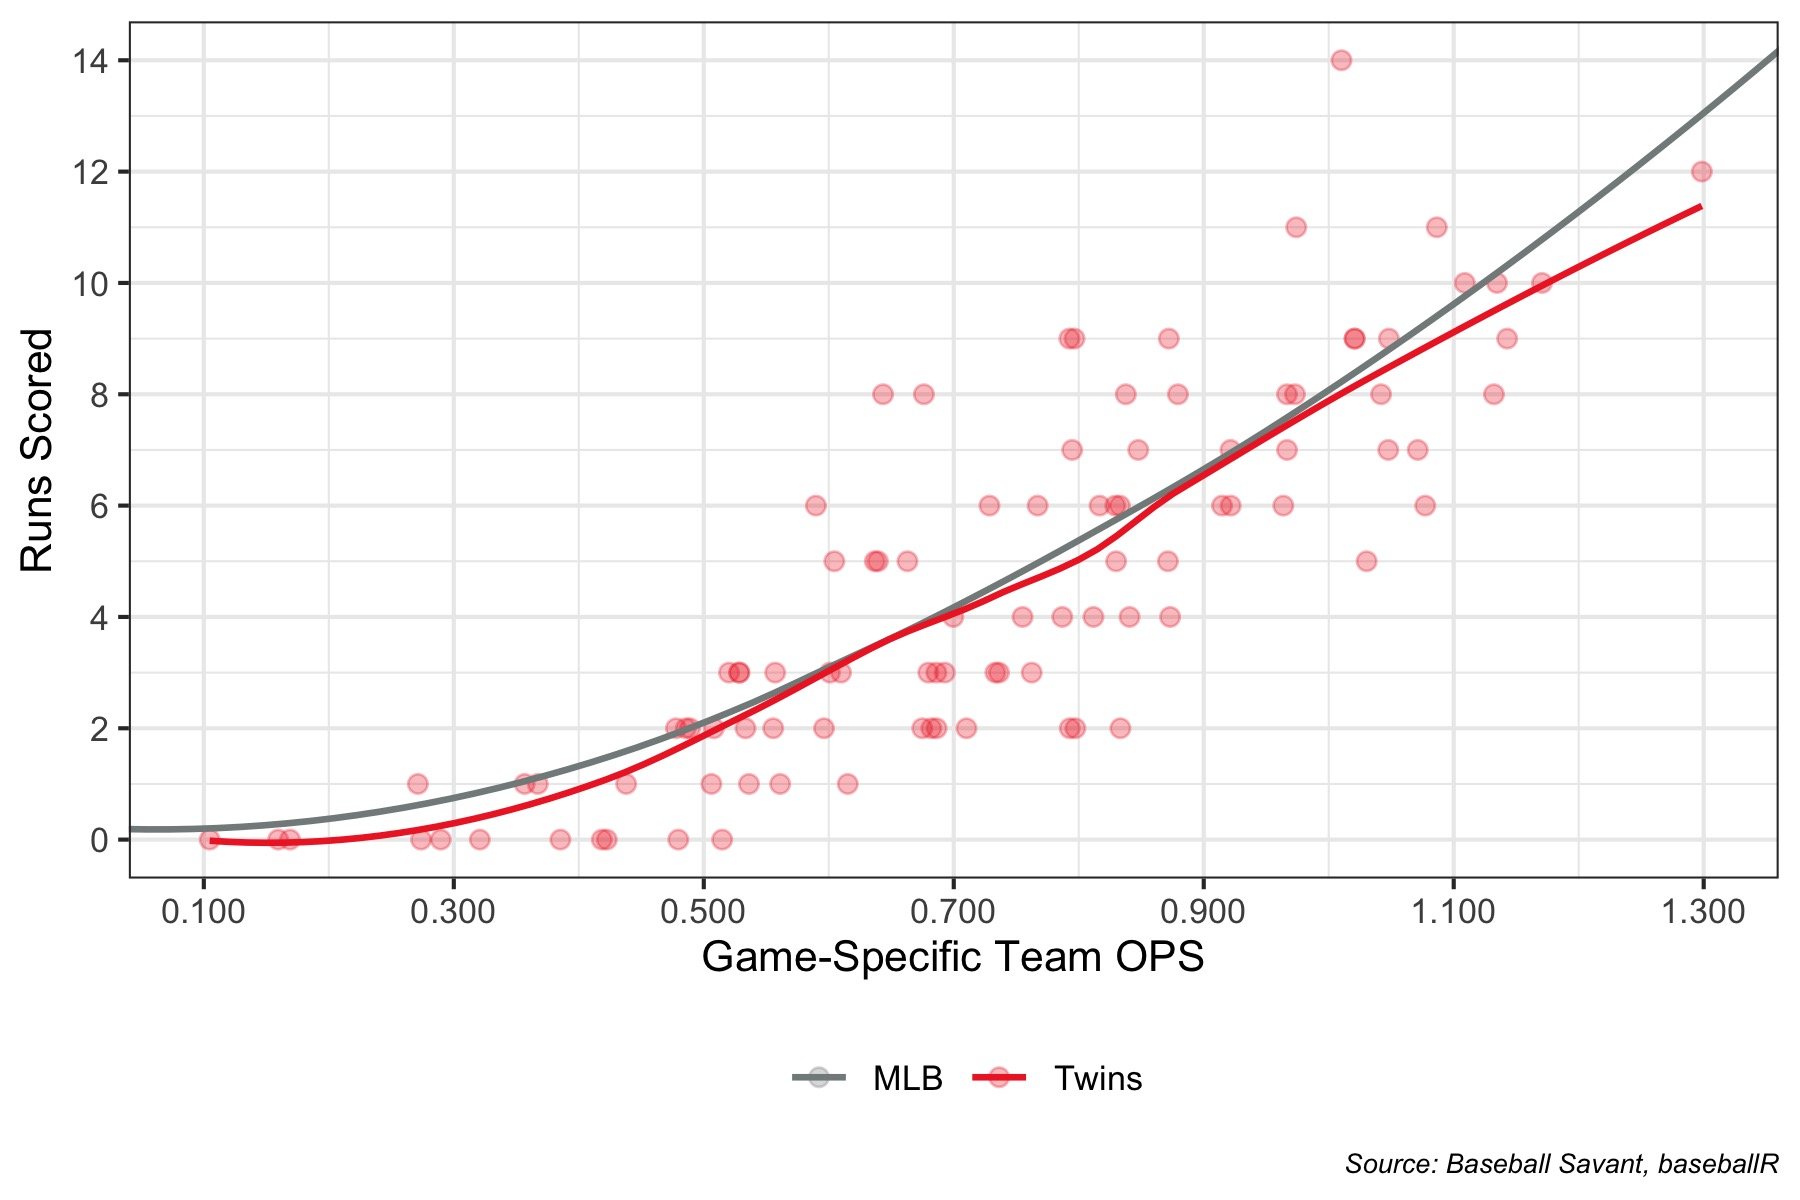 The above graph shows, for each Twins game this season, their game-specific team OPS and the runs scored in red. The solid red line is a moving average specific to the Twins. It measures how many runs the Twins typically score in a game given the OPS on the x axis. The solid gray line is the rest of the MLB. You can interpret these lines as "how each group turns OPS into runs". For example, when the Twins have an OPS around 0.600, they typically score 3 runs. Ditto for the rest of the MLB. The more interesting story appears where the lines diverge. Where the Twins line is lower than the MLB line, there are missing runs. The left side of the graph shows missing runs in games where the Twins bats go cold. The Twins have had 17 games with an OPS of less than 0.500. Typically, teams find a way to scratch across 1 or 2 runs when this happens. The Twins, however, have been more frequently shut out on these occasions. The right side of the graph has missing runs as well. The Twins have had 6 games with an OPS of more than 1.100 and only once scored more runs than expected in these games. For example, the Twins had a 1.132 OPS against Michael Kopech and the White Sox on July 5th but only scored 8 runs. A typical team scores 10 runs with that kind of production. There are two missing runs. (Rest easy, the Twins won 8 to 2.) Why the Twins don't turn OPS into runs is still up for debate. But it's clear that it happens at both ends of the spectrum: in the games where the lineup struggles and in games where it mashes.
 -
The Twins are 5th in baseball in team OPS but only 13th in runs scored per game. An additional 0.19 runs per game would move them to 5th in run scored per game, suggesting there are 18 missing runs. Where are they and why are they missing? The above graph shows, for each Twins game this season, their game-specific team OPS and the runs scored in red. The solid red line is a moving average specific to the Twins. It measures how many runs the Twins typically score in a game given the OPS on the x axis. The solid gray line is the rest of the MLB. You can interpret these lines as "how each group turns OPS into runs". For example, when the Twins have an OPS around 0.600, they typically score 3 runs. Ditto for the rest of the MLB. The more interesting story appears where the lines diverge. Where the Twins line is lower than the MLB line, there are missing runs. The left side of the graph shows missing runs in games where the Twins bats go cold. The Twins have had 17 games with an OPS of less than 0.500. Typically, teams find a way to scratch across 1 or 2 runs when this happens. The Twins, however, have been more frequently shut out on these occasions. The right side of the graph has missing runs as well. The Twins have had 6 games with an OPS of more than 1.100 and only once scored more runs than expected in these games. For example, the Twins had a 1.132 OPS against Michael Kopech and the White Sox on July 5th but only scored 8 runs. A typical team scores 10 runs with that kind of production. There are two missing runs. (Rest easy, the Twins won 8 to 2.) Why the Twins don't turn OPS into runs is still up for debate. But it's clear that it happens at both ends of the spectrum: in the games where the lineup struggles and in games where it mashes. View full article


