



Otto von Ballpark
-
Posts
20,669 -
Joined
-
Last visited
-
Days Won
74
Content Type
Profiles
Minnesota Twins News, Rumors & Analysis
Minnesota Twins Videos
2026 Minnesota Twins Top Prospect Rankings
2022 Minnesota Twins Draft Picks & Signing Bonuses
Minnesota Twins Trade & Free Agent Rumors
Minnesota Twins Fan Guides & Resources
2023 Minnesota Twins Draft Picks & Signing Bonuses
The Minnesota Twins Players Project
2024 Minnesota Twins Draft Picks & Signing Bonuses
2025 Minnesota Twins Draft Picks & Signing Bonuses
2026 Minnesota Twins Draft Picks & Signing Bonuses
Forums
Blogs
Events
Store
Downloads
Gallery
Everything posted by Otto von Ballpark
-
I don't think anyone is saying that. By Fangraphs, the Royals were 141 runs above replacement on offense, 171 runs above replacement in pitching, and 68 runs above replacement (average) in fielding. Subtracting 80 runs from any of those is going to hurt. Not sure that it says anything about which is relatively more valuable.
-
Actually, both WARs (Fangraphs and B-Ref) including a defensive adjustment in their pitching WAR. Apologies if I confused the issue previously! Fangraphs just starts from FIP, I think. B-Ref starts with runs allowed. (I think? )
-
Every one of the Royals 2014 starters outperformed their FIP. They were 13th by FIP-, only 4% ahead of the Twins. And their starters pitched over twice as many innings as their relievers. Replacing one of the best defenses in MLB with one of the worst defenses in MLB might have that affect on such a staff. I think you're discounting what it means to be a top-5 defense and a bottom-5 defense. The Royals bullpen was a lot better, but bullpens pitch fewer innings. It probably had an effect on their Pythag luck (Royals +5 Pythag wins, Twins -5). If the 2014 Twins had that defense, and that bullpen/Pythag luck, they absolutely would have been a contender. (Probably would have lost in the first round of the playoffs, though. )
-
Roughly half a run seems to span the vast majority of teams, but there will be a few outliers, just like batting and pitching. And outliers don't invalidate the calculation. Seems true, but don't know if that's the right measure to calibrate this calculation, though. All of the best hitters and pitchers are virtually always starting in MLB. All of the best fielders almost certainly are not. And the worst hitters and pitchers often get sent to the bench, minors, or DL pretty quick. The worst fielders in that group that makes it to MLB probably stick around in MLB longer.
-
That's definitely interesting if you are trying to apportion credit between players (and even coaches/scouts). But just for making the calculation on a team level, it doesn't really matter if it was positioning or speed or skill -- it just happened.
-
Why hits? Why not just runs? Adding 0.5 runs per game to the 2014 Royals would swing their run differential from +27 to -54. It would drop their Pythag by 9 wins. It would have taken them from the 4th best fielding team in MLB (by B-Ref) to the 5th worst. Is that so unreasonable an outcome?
-
You might be right. 26 out of 30 teams were within 0.54 defensive runs per game of each other last year, by B-Ref. (25 teams within 0.59 by Fangraphs.) By comparison, to include 26 teams in the range for batting runs at B-Ref, the runs per game gulf widens to 0.86. Pitching? 0.88 runs per game. (Fangraphs drops the pitching range to 0.63 due to their use of FIP, but it is still higher than fielding.)
-
That is counterbalanced slightly by the fact that Robinson would need to bump someone from the 40-man roster in order to make the team. Oliveros and Thompson seem like the most likely candidates (although those spots might also be needed by a new reliever like Boyer, Hamburger, etc.).
-

Molitor may tinker with bullpen usage
Otto von Ballpark replied to gunnarthor's topic in Minnesota Twins Talk
I remember an article (from last year?) where Perkins stated that he liked the more regimented bullpen. So I don't expect any drastic changes, although getting 2 innings out of a hot hand is good change. (I remember the article because I criticized the implications of its premise -- just because a player thinks they are more comfortable doesn't mean it affects their performance. Assuming you give them adequate time to warm up, they will probably adapt to the new circumstances just fine. Perk can make his nightly mid game bathroom trip an inning earlier. ) -
Molitor may tinker with bullpen usage
Otto von Ballpark replied to gunnarthor's topic in Minnesota Twins Talk
You may be right on a larger point with Gardy, but in regards to the bullpen, the Twins really got it done from 2002-2010. (After that, they failed everywhere, of course!) -
Article: A preview of 2015 MLB Team Defenses.
Otto von Ballpark replied to jimmer's topic in Twins Daily Front Page News
Furthermore, that link doesn't claim that year to year correlation is the "big issue" with defensive stats. It says that parsing out positioning vs. skill is the issue for individual players. But that's not really an issue at all on a team level (team positioning IS a skill for the team). -
Article: A preview of 2015 MLB Team Defenses.
Otto von Ballpark replied to jimmer's topic in Twins Daily Front Page News
Thanks for the link, but "quite as strongly" does not equal "wildly inaccurate". Also, that was looking at year to year player stats. You claimed that year to year TEAM stats (over 9 times larger than the sample of a single player) were "wildly inaccurate." Also, why couldn't the 2004 Twins have ranked 8th in a 14 team league? Cuddyer logged significant innings at 2B that year, an injured Shannon Stewart was often in LF, and even Matt LeCroy played the field. Hunter had a DL stint that year too. So what if they should have ranked 6th instead, like they did in 2003? Again, that example does not suggest anything "wildly inaccurate" at the team level. Less accurate than batting and pitching stats at the team level, sure, no problem. But that's not what you claimed (and it's not what some posters seem to rail against at every mention of defensive stats). -
Some player statistics that might prove interesting
Otto von Ballpark replied to DocBauer's topic in Minnesota Twins Talk
Using the career numbers for the other guys probably skews things more. You're including the years that got them cut from the Twins (Reboulet's 1996 comes to mind), not to mention their decline phase years. Three of these guys played until age 35+, so I would hope Nunez's stats through age 27 compare favorably with their career numbers! Also OPS/OPS+ skews things in Nunez's favor, as it is generally understood that OPS overvalues SLG compared to OBP. Rbat would be a better figure to use (and can easily be combined with Rbaser and Rdp to include base running value). And of course you're glossing over defense and positional ability, which is probably the most important consideration for a utility infielder. Still, using career numbers, here's another look: Nunez is 13 runs better on offense (per 502 PA) than the worst of this group, but he gives that away and more on defense (20 runs worse per 1200 innings than the next worst defender Hocking). He's 19 runs worse per season overall compared to the average of the other 4, which is about 2 full wins per season. Nunez also appears to have less "versatility" than the others too -- less than 5% of his career innings have been logged at 2B, and his SS innings are already trending down at age 27.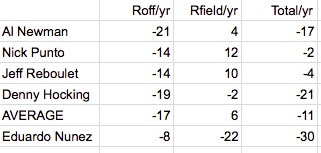
-
Some player statistics that might prove interesting
Otto von Ballpark replied to DocBauer's topic in Minnesota Twins Talk
If it is Nunez, hopefully he is just there in case of injury. Outside of the four guys ahead of him, they don't have another middle infielder on the roster except for Jorge Polanco, who they were willing to call up last year but maybe they want to avoid that this year? The only other 3B capable guy on the 40-man is Sano, and they certainly don't want to force his call-up to cover for an injury. That said, even if they don't want to call on Polanco in an emergency again, they have some fungible parts on the 40-man roster they could easily remove to call up Bernier, Beresford, etc.: Oliveros Pressly Stauffer Thompson Nunez himself -
Some player statistics that might prove interesting
Otto von Ballpark replied to DocBauer's topic in Minnesota Twins Talk
TK also had a 10 man pitching staff (actually maybe only 9 in the playoffs). Even as late as 2001 TK only had an 11 man staff. He could afford to carry a 2nd utility infielder. Holy cow, was Jason Maxwell ever a waste of a roster spot in 2001. He apparently was on the team the whole season except June when he was injured, and he got into 39 games, 21 starts, 78 PA, 53 OPS+. After a 56 OPS+ the year before. Nunez should be better than that, although barring injury, I don't know that his usage should be much more. -
Article: A preview of 2015 MLB Team Defenses.
Otto von Ballpark replied to jimmer's topic in Twins Daily Front Page News
Cite on that last point? Last time I looked, I didn't think year to year team defensive performance was any more volatile than year to year batting or pitching performances. Are batting and pitching numbers "inaccurate" too? -
Article: A preview of 2015 MLB Team Defenses.
Otto von Ballpark replied to jimmer's topic in Twins Daily Front Page News
Yup. (Actually about 7 -- it appears a WAR "win" was worth about 9.1 runs in 2014.) And if a regressed projection has a 7 WAR gulf between the best and worst defenses, it shouldn't be that surprising to see a 12-13 WAR actual difference between the best and worst. Just like hitting and pitching projections aren't going to reflect the over performers (Danny Santana, Phil Hughes) and the under-performers (Hicks, Nolasco). -
Article: A preview of 2015 MLB Team Defenses.
Otto von Ballpark replied to jimmer's topic in Twins Daily Front Page News
Cleveland's OPS+ was 102, KC's 91. That's not a huge difference when comparing two players, but that's two whole TEAMS. Two groups of nine full-time spots. KC's ERA+ was 114, and Cleveland's was 104. Another big difference. But that's pitching + defense. Can we try to isolate the two? What would be your best guess for doing that? Considering that Cleveland had the Cy Young Award winner in Kluber, Carrasco/House pitching very well, and a solid bullpen, I don't know if their pitching was really that much worse. Every one of KC's starters outperformed his FIP. Every one of Cleveland's except for House under-performed. Add in the eye test and the names that each team was putting in the field, and it doesn't surprise me that there would be a pretty big defensive gulf between these two clubs. No, I don't know that it was exactly 120 runs worth, but something approaching that should not be a shocker. -
Article: A preview of 2015 MLB Team Defenses.
Otto von Ballpark replied to jimmer's topic in Twins Daily Front Page News
First of all, it's not a run a game, it's .075-.8 runs per game. That's a difference of 25-30% -- and you're the one complaining about someone "overstating their case"? Second of all, RAR figures do have adjustments in them. Otherwise, Seattle and San Diego would probably lead the league in defensive RAR every year. Third, look at the RAR breakdown numbers I posted above. What would be a more appropriate breakdown, in your eyes? It may not be exactly the same as Fangraphs or B-Ref, but I can't imagine it being more than 25-30% different, which is apparently within an acceptable range. -
Article: A preview of 2015 MLB Team Defenses.
Otto von Ballpark replied to jimmer's topic in Twins Daily Front Page News
Also, eye test: KC had 3 Gold Glove winners, plus a shortstop who won the previous year. And that doesn't even include starting CF Cain and 4th OF / defensive replacement Dyson, who by all accounts have been fantastic defenders. Plus Moustakas and Infante, who are no slouches. -
Article: A preview of 2015 MLB Team Defenses.
Otto von Ballpark replied to jimmer's topic in Twins Daily Front Page News
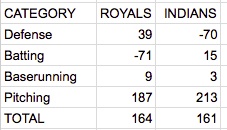
How would you explain that the Royals won 4 more games than the Indians, with a comparable pitching staff and a much worse offense? Here's another way to look at the breakdown -- Fangraphs RAR (runs above replacement) breakdown for the two teams: That is a 68.8 run difference. That's about a 7 win difference, not too far from their actual 4 win difference. B-Ref version: That puts them almost equal, which is what their run differentials and Pythag records suggest too.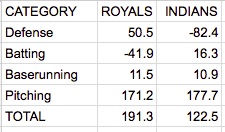
-
Article: A preview of 2015 MLB Team Defenses.
Otto von Ballpark replied to jimmer's topic in Twins Daily Front Page News
I actually agree with you, but by WAR, the hitting/pitching gulf isn't that wide. In the AL for 2014, by Fangraphs RAR, it was a 148 run difference between best and worst teams on offense, 134 for fielding, and only 72 for pitching. At B-Ref, it is 145 for hitting/baserunning, 121 for defense, and 160 for pitching. -
Article: A preview of 2015 MLB Team Defenses.
Otto von Ballpark replied to jimmer's topic in Twins Daily Front Page News
I assume that Fangraphs WAR is already adjusted for parks and opponents. (Otherwise, the Padres would presumably lead the league in dWAR every year.) -
MLB.com has it. Main stats pages and player pages should have drop down menus to select spring training and past years spring training too.
-
I think the fact they were so willing to indulge his starting preference suggests they don't see him as a high-upside bullpen project, which is disappointing.