



Jamie Cameron
-
Posts
1,349 -
Joined
-
Last visited
-
Days Won
4
Content Type
Profiles
Minnesota Twins News, Rumors & Analysis
Minnesota Twins Videos
2026 Minnesota Twins Top Prospect Rankings
2022 Minnesota Twins Draft Picks & Signing Bonuses
Minnesota Twins Trade & Free Agent Rumors
Minnesota Twins Fan Guides & Resources
2023 Minnesota Twins Draft Picks & Signing Bonuses
The Minnesota Twins Players Project
2024 Minnesota Twins Draft Picks & Signing Bonuses
2025 Minnesota Twins Draft Picks & Signing Bonuses
2026 Minnesota Twins Draft Picks & Signing Bonuses
Forums
Blogs
Events
Store
Downloads
Gallery
Everything posted by Jamie Cameron
-
In mid-March, I wrote about Ryan Pressly, noting some details about his vertical release point and breaking ball command limiting his 2017 ceiling. Pressly is off to an incredibly hot start. Through 12 IP, Pressly has a 12.0 K/9, 2.25 BB/9, and a FIP of just 1.26. Image courtesy of © Kim Klement-USA TODAY Sports In mid-March, I wrote about Ryan Pressly, noting some details about his vertical release point and breaking ball command limiting his 2017 ceiling. Pressly is off to an incredibly hot start. Through 12 IP, Pressly has a 12.0 K/9, 2.25 BB/9, and a FIP of just 1.26. Looking at Pressly’s vertical release points (which have natural variance over the course of the season) there was some splitting of his release points of his fastball and slider in May of 2017 (in which he put up an ERA of 11.00). In other words, his release points were getting further away from each other, potentially resulting in tipping his fastball or slider to opposing hitters. Thus far in 2018, his vertical release points have been extremely consistent, he’s even brought the release of his fastball and slider closer together. Let’s check in on Pressly’s slider. Here’s a snapshot of Pressly’s slider location in 2017. Here’s the 2018 version so far. So far so good. Not only is Pressly throwing his slider a significant amount more, he’s doing do with infinitely better command. Pressly has consistently located breaking pitches down and away from RHH and down and in to LHH thus far in 2018. The results have been highly effective. Meanwhile, elsewhere in baseball, there have been some notable starting pitching performances this season. New names like Ohtani have impressed, and established powerhouses like Scherzer have continued to dominate. Two pitchers who have made notable strides in 2018 are Astros Gerrit Cole and Diamondbacks Patrick Corbin. While these two pitchers didn’t start the season with the same pedigree, both have something in common. They’ve moved away from their fastball in favor of an increased reliance on a dominant breaking pitch. Recent seasons have seen analytically inclined teams moving front line starting pitchers away from ‘establishing the fastball’ to relying on their best breaking pitch. This is hardly a ground-breaking thought. Throw what you throw best, more of the time. For both Cole and Corbin, a shift in pitch-mix has had an incredible impact on their early 2018 performance. Consider the following: OK, who cares? Well, this shift in starting pitcher pitch mix has been coupled with pitchers throwing an increased number of pitches outside the strike zone. But what about relievers? What are the implications for relief pitchers who throw more than two pitches dabbling with their pitch mix? Here’s a look at Ryan Pressly’s mix over the last two seasons. It’s extremely early in the season, so there’s a chance Pressly’s breaking pitch usage will revert to something resembling last year. Throughout his career, he has oscillated between throwing his breaking pitches in the range of 40%-50%, although never with such control. Pressly has even seen small increases in spin rate of both his slider and curveball in 2018. The adjustment in his pitch mix so far however (combined with much improved command) is similar to those of Cole and Corbin and has had strikingly similar results. It’s also probable that Pressly will come back down to earth in the near future. However, his start is one of the few encouraging signs for a Twins team whose relief pitching as a whole, has been a severe letdown in 2018. View full article
-
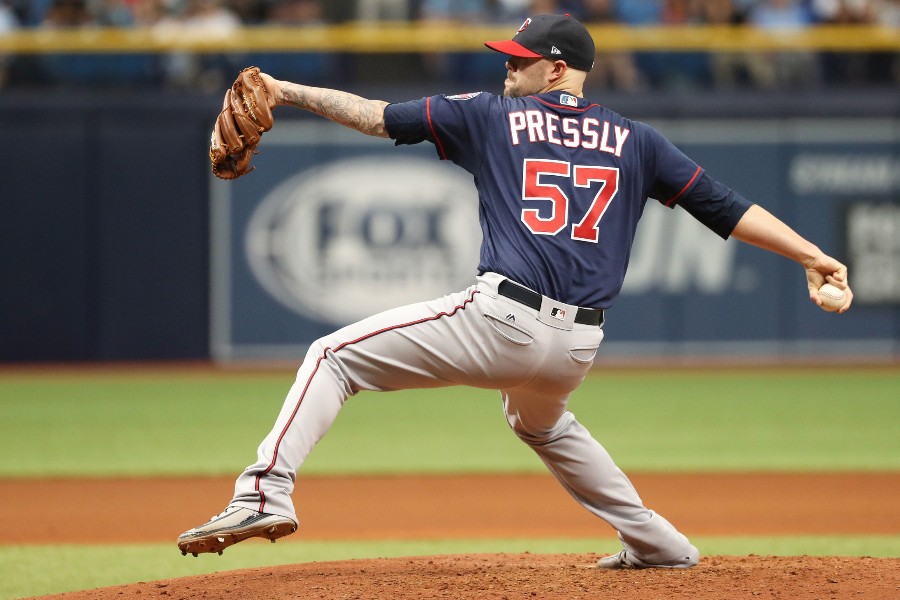 Looking at Pressly’s vertical release points (which have natural variance over the course of the season) there was some splitting of his release points of his fastball and slider in May of 2017 (in which he put up an ERA of 11.00). In other words, his release points were getting further away from each other, potentially resulting in tipping his fastball or slider to opposing hitters. Thus far in 2018, his vertical release points have been extremely consistent, he’s even brought the release of his fastball and slider closer together. Let’s check in on Pressly’s slider. Here’s a snapshot of Pressly’s slider location in 2017. Here’s the 2018 version so far. So far so good. Not only is Pressly throwing his slider a significant amount more, he’s doing do with infinitely better command. Pressly has consistently located breaking pitches down and away from RHH and down and in to LHH thus far in 2018. The results have been highly effective. Meanwhile, elsewhere in baseball, there have been some notable starting pitching performances this season. New names like Ohtani have impressed, and established powerhouses like Scherzer have continued to dominate. Two pitchers who have made notable strides in 2018 are Astros Gerrit Cole and Diamondbacks Patrick Corbin. While these two pitchers didn’t start the season with the same pedigree, both have something in common. They’ve moved away from their fastball in favor of an increased reliance on a dominant breaking pitch. Recent seasons have seen analytically inclined teams moving front line starting pitchers away from ‘establishing the fastball’ to relying on their best breaking pitch. This is hardly a ground-breaking thought. Throw what you throw best, more of the time. For both Cole and Corbin, a shift in pitch-mix has had an incredible impact on their early 2018 performance. Consider the following: OK, who cares? Well, this shift in starting pitcher pitch mix has been coupled with pitchers throwing an increased number of pitches outside the strike zone. But what about relievers? What are the implications for relief pitchers who throw more than two pitches dabbling with their pitch mix? Here’s a look at Ryan Pressly’s mix over the last two seasons. It’s extremely early in the season, so there’s a chance Pressly’s breaking pitch usage will revert to something resembling last year. Throughout his career, he has oscillated between throwing his breaking pitches in the range of 40%-50%, although never with such control. Pressly has even seen small increases in spin rate of both his slider and curveball in 2018. The adjustment in his pitch mix so far however (combined with much improved command) is similar to those of Cole and Corbin and has had strikingly similar results. It’s also probable that Pressly will come back down to earth in the near future. However, his start is one of the few encouraging signs for a Twins team whose relief pitching as a whole, has been a severe letdown in 2018.
-
Max Kepler, in and of himself, is a marvel. Not too many European players make it to the major leagues. Kepler signed for the Twins for around $800,000 in 2009. Nine year later, he looks like he’s on the cusp of a major offensive breakout which could propel the Twins’ already excellent outfield to one of best and most balanced in the majors. None of this is news, however, the terms of Kepler’s offensive improvement are intriguing. Image courtesy of © Kim Klement-USA TODAY Sports Max Kepler, in and of himself, is a marvel. Not too many European players make it to the major leagues. Kepler signed for the Twins for around $800,000 in 2009. Nine year later, he looks like he’s on the cusp of a major offensive breakout which could propel the Twins’ already excellent outfield to one of best and most balanced in the majors. None of this is news, however, the terms of Kepler’s offensive improvement are intriguing. Kepler put up decent numbers in 2017. Through 147 games he managed a .243/.312/.425 line with 19 HR and 69 RBI, nice. Digging a little deeper into Kepler’s 2017, there were some troubling trends. Kepler’s BB% decreased, down to 8.3%, while his K% remained consistent, around 20%. Kepler’s wOBA remained remarkably consistent to its 2016 figure, an unremarkable .315. Hitting Lefties It’s also been well documented that Kepler really struggled against lefties. It’s important here to take a step back and realize just how horrible most lefties are against lefties. Justin Morneau, one of the best left-handed Twins of all time, hit just .253 against lefties. Joe Mauer, Mr. 2,000 himself, has a career .290 average against lefties. He is an exception. My point here is simply that it’s not unusual for left handed hitters to have extreme splits in their offensive numbers. Unless your name is Ichiro Suzuki (.330 career avg. against LHP), the struggle is real. In 2017 however, Kepler was truly rancid against left-handed pitching. In 125 ABs he managed a .125/.213/.240 line with a 5% BB% and a K% of 30. Rough. By contrast, against righties in 2017 Kepler put together a strong .272/.343/.484 line with almost double the walks and almost half the strikeouts. Kepler’s hitting of lefties is a little like the Vikings O-Line going into 2017, it doesn’t have to be great, because there’s a lot else to like. It just has to be good enough. This spring, Kepler spent significant time with the aforementioned Morneau, who had similar splits early in his career with the Twins, before improving significantly against LHP later in his career with the Twins. So far, the results have been encouraging. Through an incredibly small sample, Kepler is hitting .250/.400/.500 against LHP, and has yet to strike out. Time will tell if Kepler is improving against LHP, but in a lineup dominated by left-handed bats, it’s an important step to maximize Paul Molitor’s lineup flexibility. Pitch Recognition Another area of interest in digging into Kepler’s numbers is pitch recognition. It’s been noted repeatedly that opposing pitchers are going after several young Twins hitters (most notably Miguel Sano and Byron Buxton) increasingly with breaking pitches. Here’s a look at Kepler’s results against pitches he saw at least 200 of in 2017. Looking at the numbers, it’s evident that Kepler was struggling significantly to recognize and react to breaking pitches. Hardly uncommon for a young hitter, but for the sake of comparison, Byron Buxton hit .206 and .250 against sliders and curveballs respectively, in 2017. Now let’s look at the early returns from Kepler’s 2018. *Info does not include data from the Puerto Rico games. Please don’t hit me with the ‘small sample size’ comments. I get it, it’s incredibly early. Kepler however, is showing some improvement in recognizing breaking pitches, evidenced by destroying two for homeruns against the defending champion Houston Astros in a game the Twins tried extremely hard to throw away. It’s early, but be encouraged. Overall, Kepler’s early start shows several promising trends. His BB% is up to 16%, his K% is down to under 10%, and his OBP is up 60 points to .381. Launch Angle and Exit Velocity The last noticing on Kepler’s hot start is how the ball is coming off the bat. Mike Berardino wrote an excellent article in March detailing Kepler’s approach at the plate. “For me, it’s not about launch angle, it’s about getting my bat head in the zone as early as possible”, Kepler offers to Berardino. What Kepler is referring to squaring up the ball, the plane of his swing, and generating excellent bat speed. Launch angle is to hitting as framing is to catching, it has become THE encompassing soundbite in a skill set made up of dozens of important factors. Exit velocity is actually a better predictor of outcomes for hitters. The harder you hit the ball, the better things are likely to go. In 2017, Kepler’s average exit velocity was 88.3 mph. Early in 2018, it’s up to 91.8 mph. Drilling down to isolating breaking pitches, the contrast is even more stark. In 2017, Kepler’s exit velocity on sliders and curveballs was 86mph. Thus far in 2018, it is 97.9 mph. That’s not the kind of difference you can generate unless your pitch recognition has improved significantly. It’s still incredibly early in the season, particularly for the Twins (who are several games behind everyone else!) Kepler’s start however, should have Twins fans excited, as it appears he has made some important adjustments throughout the offseason. What do you think Kepler’s ceiling is this year? What kind of numbers are you expecting from him? I’m excited to be contributing regularly at Twins Daily with a new column. Here’s the concept: Typically, the productivity of the average American plummets on a Friday afternoon. I am looking to take full advantage with a weekly amalgam of thoughts on the Twins to be released every Friday as folks are looking to pass the time between actually stopping work and heading home or to happy hour. Typically this will focus on a player of interest. However, I’m eager to write about what folks want to read about, so if you have a question or an idea, please leave it in the comments or hit me up on Twitter @J_D_Cameron. Thanks for reading! View full article
-
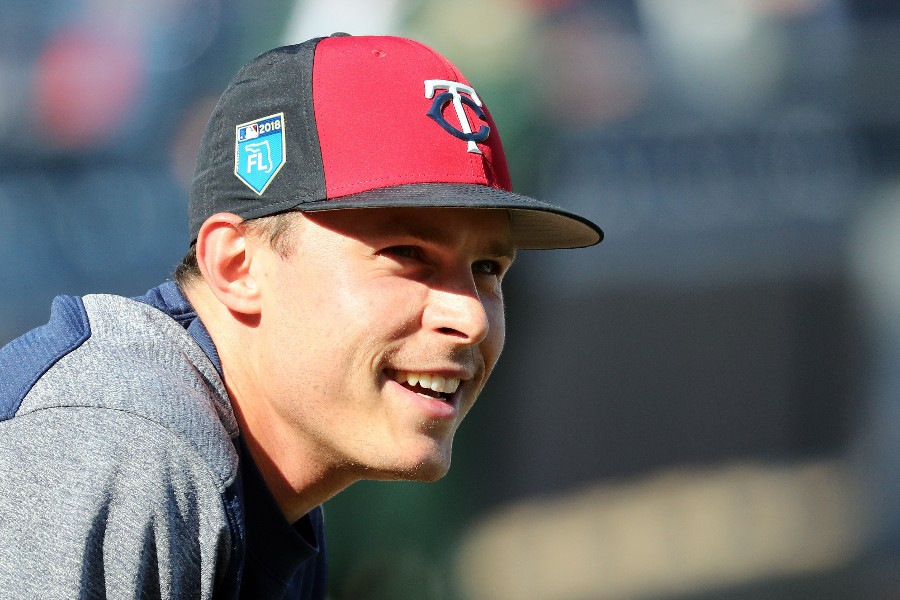 Kepler put up decent numbers in 2017. Through 147 games he managed a .243/.312/.425 line with 19 HR and 69 RBI, nice. Digging a little deeper into Kepler’s 2017, there were some troubling trends. Kepler’s BB% decreased, down to 8.3%, while his K% remained consistent, around 20%. Kepler’s wOBA remained remarkably consistent to its 2016 figure, an unremarkable .315. Hitting Lefties It’s also been well documented that Kepler really struggled against lefties. It’s important here to take a step back and realize just how horrible most lefties are against lefties. Justin Morneau, one of the best left-handed Twins of all time, hit just .253 against lefties. Joe Mauer, Mr. 2,000 himself, has a career .290 average against lefties. He is an exception. My point here is simply that it’s not unusual for left handed hitters to have extreme splits in their offensive numbers. Unless your name is Ichiro Suzuki (.330 career avg. against LHP), the struggle is real. In 2017 however, Kepler was truly rancid against left-handed pitching. In 125 ABs he managed a .125/.213/.240 line with a 5% BB% and a K% of 30. Rough. By contrast, against righties in 2017 Kepler put together a strong .272/.343/.484 line with almost double the walks and almost half the strikeouts. Kepler’s hitting of lefties is a little like the Vikings O-Line going into 2017, it doesn’t have to be great, because there’s a lot else to like. It just has to be good enough. This spring, Kepler spent significant time with the aforementioned Morneau, who had similar splits early in his career with the Twins, before improving significantly against LHP later in his career with the Twins. So far, the results have been encouraging. Through an incredibly small sample, Kepler is hitting .250/.400/.500 against LHP, and has yet to strike out. Time will tell if Kepler is improving against LHP, but in a lineup dominated by left-handed bats, it’s an important step to maximize Paul Molitor’s lineup flexibility. Pitch Recognition Another area of interest in digging into Kepler’s numbers is pitch recognition. It’s been noted repeatedly that opposing pitchers are going after several young Twins hitters (most notably Miguel Sano and Byron Buxton) increasingly with breaking pitches. Here’s a look at Kepler’s results against pitches he saw at least 200 of in 2017. Looking at the numbers, it’s evident that Kepler was struggling significantly to recognize and react to breaking pitches. Hardly uncommon for a young hitter, but for the sake of comparison, Byron Buxton hit .206 and .250 against sliders and curveballs respectively, in 2017. Now let’s look at the early returns from Kepler’s 2018. *Info does not include data from the Puerto Rico games. Please don’t hit me with the ‘small sample size’ comments. I get it, it’s incredibly early. Kepler however, is showing some improvement in recognizing breaking pitches, evidenced by destroying two for homeruns against the defending champion Houston Astros in a game the Twins tried extremely hard to throw away. It’s early, but be encouraged. Overall, Kepler’s early start shows several promising trends. His BB% is up to 16%, his K% is down to under 10%, and his OBP is up 60 points to .381. Launch Angle and Exit Velocity The last noticing on Kepler’s hot start is how the ball is coming off the bat. Mike Berardino wrote an excellent article in March detailing Kepler’s approach at the plate. “For me, it’s not about launch angle, it’s about getting my bat head in the zone as early as possible”, Kepler offers to Berardino. What Kepler is referring to squaring up the ball, the plane of his swing, and generating excellent bat speed. Launch angle is to hitting as framing is to catching, it has become THE encompassing soundbite in a skill set made up of dozens of important factors. Exit velocity is actually a better predictor of outcomes for hitters. The harder you hit the ball, the better things are likely to go. In 2017, Kepler’s average exit velocity was 88.3 mph. Early in 2018, it’s up to 91.8 mph. Drilling down to isolating breaking pitches, the contrast is even more stark. In 2017, Kepler’s exit velocity on sliders and curveballs was 86mph. Thus far in 2018, it is 97.9 mph. That’s not the kind of difference you can generate unless your pitch recognition has improved significantly. It’s still incredibly early in the season, particularly for the Twins (who are several games behind everyone else!) Kepler’s start however, should have Twins fans excited, as it appears he has made some important adjustments throughout the offseason. What do you think Kepler’s ceiling is this year? What kind of numbers are you expecting from him? I’m excited to be contributing regularly at Twins Daily with a new column. Here’s the concept: Typically, the productivity of the average American plummets on a Friday afternoon. I am looking to take full advantage with a weekly amalgam of thoughts on the Twins to be released every Friday as folks are looking to pass the time between actually stopping work and heading home or to happy hour. Typically this will focus on a player of interest. However, I’m eager to write about what folks want to read about, so if you have a question or an idea, please leave it in the comments or hit me up on Twitter @J_D_Cameron. Thanks for reading!
-
Jason Castro and a Cup of Coffee
Jamie Cameron replied to Jamie Cameron's topic in Twins Daily Front Page News
Agree with this 100% -
Jason Castro and a Cup of Coffee
Jamie Cameron replied to Jamie Cameron's topic in Twins Daily Front Page News
Thanks for reading! I think something you speak to which is impossible to measure is Castro's impact on the staff. Established catcher with solid D gives him cred with veterans like Santana and confidence in him from up and comers like Berrios. -
Jason Castro and a Cup of Coffee
Jamie Cameron replied to Jamie Cameron's topic in Twins Daily Front Page News
Great point, I would agree. -
Jason Castro and a Cup of Coffee
Jamie Cameron replied to Jamie Cameron's topic in Twins Daily Front Page News
Thanks for sharing, great stories! -
Jason Castro and a Cup of Coffee
Jamie Cameron replied to Jamie Cameron's topic in Twins Daily Front Page News
Thanks, Brock! Really appreciate it! -
Jason Castro and a Cup of Coffee
Jamie Cameron replied to Jamie Cameron's topic in Twins Daily Front Page News
Let's try and get 'Jason Castro out of 10' to stick! Outstanding! -
Jason Castro and a Cup of Coffee
Jamie Cameron replied to Jamie Cameron's topic in Twins Daily Front Page News
I think when the Twins went with Castro, they were in a pretty difficult position, due to: 1) Having Suzuki - who is terrible defensively 2) Not having an in-house option who was major league ready 3) The catcher FA market is always going to be pretty thin. I think Castro just ended up being really good timing for MN Agree that organizations should work hard to develop in-house options. -
Jason Castro and a Cup of Coffee
Jamie Cameron replied to Jamie Cameron's topic in Twins Daily Front Page News
Thanks for taking the time to read it! -
Jason Castro and a Cup of Coffee
Jamie Cameron replied to Jamie Cameron's topic in Twins Daily Front Page News
Thanks for reading! -
Jason Castro and a Cup of Coffee
Jamie Cameron replied to Jamie Cameron's topic in Twins Daily Front Page News
Yeah this is interesting. I don't think it's a crazy question at all. Garver simply hasn't played a ton at the MLB level. While I think he will, time will tell if his bat will play with the big league team. Additionally, he's not known as a strong defender, although there's always room to develop there. Finally, Castro is in the second year of a 3 year $24.5 million contract so he'll be the guy for the foreseeable future. If Garver can rake though, there's no reason to not get his bat in the lineup more. Tons of MLB clubs split catcher time more equitably than the Twins currently do (Dodgers are a good example). -
Jason Castro and a Cup of Coffee
Jamie Cameron replied to Jamie Cameron's topic in Twins Daily Front Page News
Yeah....I guess I felt like the 3 paragraphs I spent explaining my analogy would be enough for folks to differentiate between the two. -
Jason Castro and a Cup of Coffee
Jamie Cameron replied to Jamie Cameron's topic in Twins Daily Front Page News
LOL! -
I was sitting down the third base line at Target Field on April 5th, giving me an excellent view of Mitch Garver’s timely first big league home run. This got me to thinking about Jason Castro, and catching in general. OK. Let’s get weird. Image courtesy of Mark J. Rebilas-USA TODAY Sports I was sitting down the third base line at Target Field on April 5th, giving me an excellent view of Mitch Garver’s timely first big league home run. This got me to thinking about Jason Castro, and catching in general. OK. Let’s get weird. When I first moved to the US, I worked in an upscale deli. I had just been given permission to work, and I needed money badly, a stable income for a few months to get up and running and on my feet. At said upscale deli, ownership (I like to pretend I’m part of a baseball franchise at all times), made us do regular tastings and scorings of the deli’s offerings. Folks would bring around a tray with samples and we would all score a given sample out of ten, with some brief words of explanation. I knew I wasn’t long for the food industry when others reeled off complex descriptions of how samples affected their palette, while I typically landed into two categories; ‘delicious’ or ‘not my thing’. What does this have to do with catching? I promise I’m going somewhere with this. Invariably, scores on samples were really high because the deli only sold delicious food. The one exception to this was coffee. Folks typically scored coffees in the 5-7 range, instead of the typical 8-10 range of other samples? Why? Because most (including myself) didn’t know what they were looking for. What differentiates a great coffee from a good coffee? Darned if I know. So what does this have to do with baseball? My contention is, tasting fancy coffee and evaluating catchers are the same. We don’t know what we don’t know, and we can’t always account for the subtle nuances that differentiate good from great. So I set out to try to gain a better understanding of the question; what goes into making a good catcher? Where does Jason Castro fall in these criteria? Hitting Let’s start with some general numbers on Castro. The reason I wanted to acknowledge hitting is it seems to me that there is generally a poor understanding of what an average offensive catcher looks like in MLB. Catchers like Gary Sanchez, Buster Posey and J.T. Realmuto tend to skew overall perception of what typical catcher offensive production looks like. Firstly, it’s important to acknowledge how useful it is to have a catcher who plays as much as Castro. In 2017, only 14 catchers made at least 400 PA. Of these 14, Castro finished 10th in fWAR (1.6). Again, of these 14, Castro finished 6th in OBP (behind only Posey, Contreras, Barnhart, Lucroy and Sanchez) and first in BB% (11.1%). While Castro isn’t a plus hitter, he gets on base enough to be a solid offensive contributor in a small group of elite catchers who play as much as he does throughout the course of the season. Framing This might seem like a weird place to go next. The reason I’m going here is that when Castro signed with the Twins, he came with a reputation as an excellent pitch framer. When Castro was brought in at the beginning of an otherwise quiet first off-season for Derrick Falvey and Thad Levine, his framing prowess was well established. In Castro’s final season in Houston, he got 96 more strikes called than expected, good for fifth in MLB. This, combined with the Twins transitioning from Kurt Suzuki, who got 38 less strikes than expected, had a significant positive swing for a Twins pitching staff expected to be mediocre at best in advance of the 2017 season. Several factors resulted in a slightly improved pitching performance in 2017, none more so than Byron Buxton. Castro certainly had an impact too, but what about the other aspects of catching we might be less familiar with? Regular Fielding ‘Regular fielding’ is an odd term. It simply doesn’t apply to catchers. While defensive metrics like UZR (ultimate zone rating) and DRS (defensive runs saved) give insight into most defensive positions, it’s too general to accurately appropriate to the catcher position. DRS, however, is a useful starting point for analyzing Castro’s fielding. DRS measures the runs saved or cost by a given player compared to a league average player at that position. In 2017 Castro finished ninth among catchers who caught at least 600 innings (34 catchers altogether), with a DRS of 10. Jonathan Lucroy was last at -15. Preventing Base Stealing Another important aspect is how catchers handle base runners. rSB is essentially DRS combined with stolen base runs above average. Castro is right around replacement level (20th in MLB among catchers who caught 600 innings) with a 0 rSB. Tucker Barnhart is first at 7. New Statcast data sheds light on Castro’s performance against base runners. Pop time measures the amount of time from the pitch hitting the catcher’s mitt to the moment the ball reaches the fielder’s receiving point at the center of the base. In 2017, Castro ranked 46th in MLB in pop time at 2.07 (MLB average 2.00). Castro ranked dead middle in MLB in his arm strength and second to last in exchange time. Essentially, he has an averagely strong arm, a slightly below average pop time but a far below average exchange of the ball from mitt to throwing hand. This resulted in Castro throwing out 26% of base runners, still good for a solid ninth in MLB, in a category where there is a large disparity between solid and great (Wellington Castillo, who ranked first, threw out almost 50% of base runners). Blocking Blocking is another element of catcher defensive performance that is difficult to measure. FanGraphs uses RPP (runs on passed pitches) which uses PITCHf/x data to attempt to measure how many runs a catcher saved based on the difficulty of corralling the pitch. PITCHf/x data may not be sufficient to inform this stat as it does not accurately measure whether a pitch should have been controlled by a catcher or not. Statcast may end up providing more accurate data to inform this measurement. FanGraphs’ last metric for Castro was 0.1 with the Astros in 2014, but a lack of data makes comparing him across MLB difficult. Game Management Finally, game management is the most difficult skill to evaluate in catcher performance. Catchers have a massive impact on how a pitcher navigates a lineup, where and what pitches they throw etc. Sports Info Solutions attempts to quantify game calling in its Catcher Pitch Calling Runs Above Average metric, or RerC, which is available at Baseball-Reference. Last season, Castro was seven runs above average per that stat. The only catcher to best that mark was Barnhart, who was 10 runs above average. When it’s all said and done, it’s extremely hard to comprehend how impactful Castro is for the Twins. At catcher, unlike any other position, there exists an intersection between offensive and defensive metrics which impact their contributions to their given team. Castro is a little below average offensively and above average defensively. If we were tasting a coffee named ‘Castro blend’ we might give it a 7 out of 10. That’s a score the Twins would gladly take over the next two years, as there are very few eights, nines and tens. View full article
-
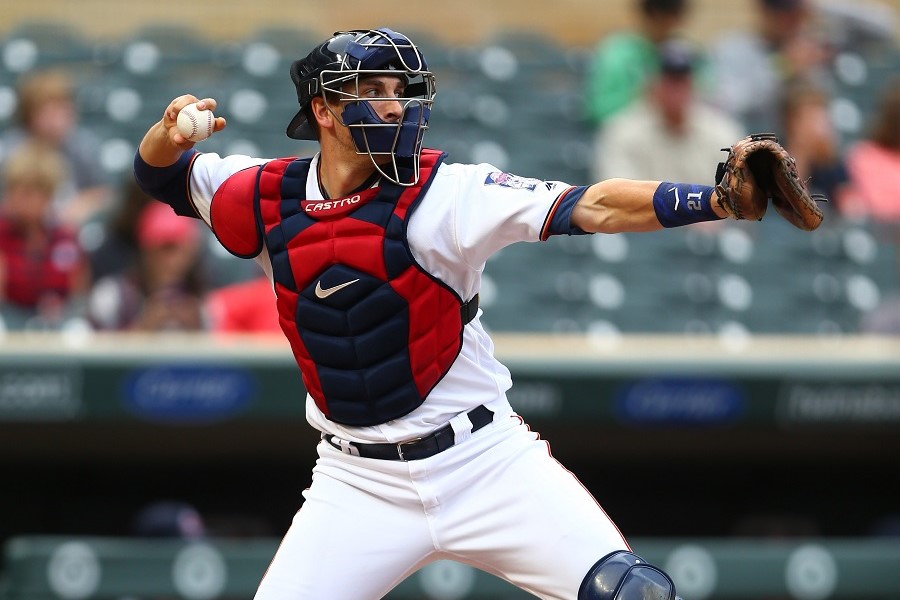 When I first moved to the US, I worked in an upscale deli. I had just been given permission to work, and I needed money badly, a stable income for a few months to get up and running and on my feet. At said upscale deli, ownership (I like to pretend I’m part of a baseball franchise at all times), made us do regular tastings and scorings of the deli’s offerings. Folks would bring around a tray with samples and we would all score a given sample out of ten, with some brief words of explanation. I knew I wasn’t long for the food industry when others reeled off complex descriptions of how samples affected their palette, while I typically landed into two categories; ‘delicious’ or ‘not my thing’. What does this have to do with catching? I promise I’m going somewhere with this. Invariably, scores on samples were really high because the deli only sold delicious food. The one exception to this was coffee. Folks typically scored coffees in the 5-7 range, instead of the typical 8-10 range of other samples? Why? Because most (including myself) didn’t know what they were looking for. What differentiates a great coffee from a good coffee? Darned if I know. So what does this have to do with baseball? My contention is, tasting fancy coffee and evaluating catchers are the same. We don’t know what we don’t know, and we can’t always account for the subtle nuances that differentiate good from great. So I set out to try to gain a better understanding of the question; what goes into making a good catcher? Where does Jason Castro fall in these criteria? Hitting Let’s start with some general numbers on Castro. The reason I wanted to acknowledge hitting is it seems to me that there is generally a poor understanding of what an average offensive catcher looks like in MLB. Catchers like Gary Sanchez, Buster Posey and J.T. Realmuto tend to skew overall perception of what typical catcher offensive production looks like. Firstly, it’s important to acknowledge how useful it is to have a catcher who plays as much as Castro. In 2017, only 14 catchers made at least 400 PA. Of these 14, Castro finished 10th in fWAR (1.6). Again, of these 14, Castro finished 6th in OBP (behind only Posey, Contreras, Barnhart, Lucroy and Sanchez) and first in BB% (11.1%). While Castro isn’t a plus hitter, he gets on base enough to be a solid offensive contributor in a small group of elite catchers who play as much as he does throughout the course of the season. Framing This might seem like a weird place to go next. The reason I’m going here is that when Castro signed with the Twins, he came with a reputation as an excellent pitch framer. When Castro was brought in at the beginning of an otherwise quiet first off-season for Derrick Falvey and Thad Levine, his framing prowess was well established. In Castro’s final season in Houston, he got 96 more strikes called than expected, good for fifth in MLB. This, combined with the Twins transitioning from Kurt Suzuki, who got 38 less strikes than expected, had a significant positive swing for a Twins pitching staff expected to be mediocre at best in advance of the 2017 season. Several factors resulted in a slightly improved pitching performance in 2017, none more so than Byron Buxton. Castro certainly had an impact too, but what about the other aspects of catching we might be less familiar with? Regular Fielding ‘Regular fielding’ is an odd term. It simply doesn’t apply to catchers. While defensive metrics like UZR (ultimate zone rating) and DRS (defensive runs saved) give insight into most defensive positions, it’s too general to accurately appropriate to the catcher position. DRS, however, is a useful starting point for analyzing Castro’s fielding. DRS measures the runs saved or cost by a given player compared to a league average player at that position. In 2017 Castro finished ninth among catchers who caught at least 600 innings (34 catchers altogether), with a DRS of 10. Jonathan Lucroy was last at -15. Preventing Base Stealing Another important aspect is how catchers handle base runners. rSB is essentially DRS combined with stolen base runs above average. Castro is right around replacement level (20th in MLB among catchers who caught 600 innings) with a 0 rSB. Tucker Barnhart is first at 7. New Statcast data sheds light on Castro’s performance against base runners. Pop time measures the amount of time from the pitch hitting the catcher’s mitt to the moment the ball reaches the fielder’s receiving point at the center of the base. In 2017, Castro ranked 46th in MLB in pop time at 2.07 (MLB average 2.00). Castro ranked dead middle in MLB in his arm strength and second to last in exchange time. Essentially, he has an averagely strong arm, a slightly below average pop time but a far below average exchange of the ball from mitt to throwing hand. This resulted in Castro throwing out 26% of base runners, still good for a solid ninth in MLB, in a category where there is a large disparity between solid and great (Wellington Castillo, who ranked first, threw out almost 50% of base runners). Blocking Blocking is another element of catcher defensive performance that is difficult to measure. FanGraphs uses RPP (runs on passed pitches) which uses PITCHf/x data to attempt to measure how many runs a catcher saved based on the difficulty of corralling the pitch. PITCHf/x data may not be sufficient to inform this stat as it does not accurately measure whether a pitch should have been controlled by a catcher or not. Statcast may end up providing more accurate data to inform this measurement. FanGraphs’ last metric for Castro was 0.1 with the Astros in 2014, but a lack of data makes comparing him across MLB difficult. Game Management Finally, game management is the most difficult skill to evaluate in catcher performance. Catchers have a massive impact on how a pitcher navigates a lineup, where and what pitches they throw etc. Sports Info Solutions attempts to quantify game calling in its Catcher Pitch Calling Runs Above Average metric, or RerC, which is available at Baseball-Reference. Last season, Castro was seven runs above average per that stat. The only catcher to best that mark was Barnhart, who was 10 runs above average. When it’s all said and done, it’s extremely hard to comprehend how impactful Castro is for the Twins. At catcher, unlike any other position, there exists an intersection between offensive and defensive metrics which impact their contributions to their given team. Castro is a little below average offensively and above average defensively. If we were tasting a coffee named ‘Castro blend’ we might give it a 7 out of 10. That’s a score the Twins would gladly take over the next two years, as there are very few eights, nines and tens.
-
If there is one thing we can all agree on regarding the 2018 Minnesota Twins, it’s that they have a higher floor than their 2017 counterparts. Still, established pieces are going to have to maintain or raise the level of their game in order to keep their jobs. Most notably; Taylor Rogers. Image courtesy of Brad Rempel-USA TODAY Sports If there is one thing we can all agree on regarding the 2018 Minnesota Twins, it’s that they have a higher floor than their 2017 counterparts. Still, established pieces are going to have to maintain or raise the level of their game in order to keep their jobs. Most notably; Taylor Rogers. Rogers was drafted by the Twins in the 11th round in 2012 out of the University of Kentucky. He exceeded rookie limits in the 2016 season and is not eligible for arbitration until 2020. With that amount of team control it's important the Twins know what they have, and what they don’t have, in the 27 year old left-hander. MLB Debut Rogers made his MLB debut in 2016, pitching 61 innings and excelled. He managed a 3.96 ERA on the back of a 9.39 K/9, 2.35 BB/9 and GB% of 51%, all really solid numbers. Rogers’ xFIP of 3.47 was indicative that he might be scratching the surface of being an excellent relief option for the Twins. Perhaps unsurprisingly, Rogers had pretty dramatic splits in 2016. Against lefties, he put together an excellent .202 BAA, .286 SLG and .281 BABIP. Conversely, Rogers struggled against righties, to the tune of a .291 BAA, .462 SLG and .348 BABIP. This led most to the conclusion that Rogers could be a viable long-term option as a LOOGY. The first half of Rogers 2017, however, would call that conclusion into question. 2017: A Tale of two Halves "It was the best of times, it was the worst of times." Words from Charles Dickens which are applicable to Rogers’ 2017. First Half: 1.87 BB/9, 0.80 HR/9, .333 SLG Second Half: 5.73 BB/9, 1.23 HR/9, .434 SLG In the first half of the 2017 season, the Twins bullpen was in flux. Not only did the big league club use a record 16 starting pitchers over the course of the season, a slew of Quadruple-A types saw time in the pen. With a stable bullpen, Rogers would likely have faced predominantly LHH. The Twins were struggling, however, and Rogers began to see RHH with increasing frequency. Surprisingly, he delivered in a big way. Prior to the end of June, Rogers managed an incredible 1.35 ERA against RHH, with a stingy .257 SLG, and .227 BAA. For the Twins, this was a boon of Hildenbergian proportions. In the first half of 2017, Rogers threw to 33% more RHH than LHH. That split evened in the second half of the season, but not significantly enough to prevent a major regression against righties, evidenced by his 5.79 ERA, .355 BAA and .581 SLG the rest of the way against RHH. It’s almost a certainty that Rogers’ first half numbers against RHH were an aberration. A return to dominance against LHH (he had been solid but unspectacular against them in the first half) helped mitigate the damage of an awful second half. All in all Rogers finished the season with numbers which would lead most to consider him a left-handed specialist. Rogers offers more than Buddy Boshers, but not a ton more. Pitch Mix Overview Rogers’ pitch mix is important to understanding why he suddenly fell off a cliff against RHH in the second half of 2017. Rogers relies on a sinker, four seam fastball, and a curveball. Additionally, he mixes in a changeup pretty infrequently (only 4% of the time in 2017). Rogers has above average velocity on most of his pitches, his fastball generating a ton of fly balls, and his changeup generating a decent number of groundballs. Rogers decreased his chageup usage as the 2017 season progressed, ditching the pitch altogether in July. Coincidentally, that was his worst month of the year. He got it to the tune of an ERA of 8.18 and gave up a .614 SLG that month. This makes sense. The changeup is an equalizing pitch to throw to opposite handed hitters (that’s why Johan Santana was so dominant). Despite not having a great changeup to begin with, Rogers was continually being put in tough situations against RHH without a weapon to neutralize them. This, in addition to an uncharacteristically high walk rate, led Rogers to an awful second half. Waiting in the Wings On one hand, there is reason for optimism for Rogers in 2018. Despite having a pretty rough spring training, it’s likely that his elevated walk rate from the second half of the season is a mechanical issue which is now resolved (two walks in 11 IP in spring training suggest as much). On the other hand, his splits are real, Rogers might not be a true LOOGY, but he isn’t a pitcher the Twins should be relying on to get out RHH on a consistent basis. Additionally, the Twins have some interesting arms waiting in the wings. Gabriel Moya (owner of an excellent changeup) is a candidate much more likely to be successful against both LHH and RHH due to his pitch mix and deceptive mechanics. Tyler Jay is another candidate to be a back end bullpen option if he can stay healthy throughout the 2018 season. If either of those pitchers have strong seasons, they may challenge for Rogers’ spot. Zach Duke is already a better iteration of a LHP who can dominate LHH due to his ability to generate ground balls instead of fly-balls. With a minor league option remaining, don’t be surprised if Rogers ends up in Rochester if he doesn’t get off to a strong start. View full article
- 1 reply
-
- 1
-

-
- taylor rogers
- gabriel moya
- (and 2 more)
-
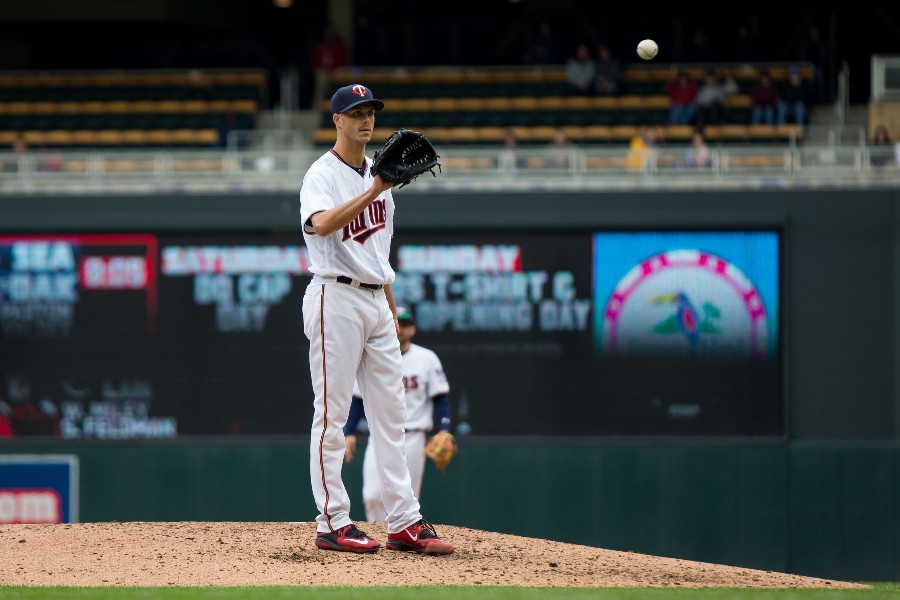 Rogers was drafted by the Twins in the 11th round in 2012 out of the University of Kentucky. He exceeded rookie limits in the 2016 season and is not eligible for arbitration until 2020. With that amount of team control it's important the Twins know what they have, and what they don’t have, in the 27 year old left-hander. MLB Debut Rogers made his MLB debut in 2016, pitching 61 innings and excelled. He managed a 3.96 ERA on the back of a 9.39 K/9, 2.35 BB/9 and GB% of 51%, all really solid numbers. Rogers’ xFIP of 3.47 was indicative that he might be scratching the surface of being an excellent relief option for the Twins. Perhaps unsurprisingly, Rogers had pretty dramatic splits in 2016. Against lefties, he put together an excellent .202 BAA, .286 SLG and .281 BABIP. Conversely, Rogers struggled against righties, to the tune of a .291 BAA, .462 SLG and .348 BABIP. This led most to the conclusion that Rogers could be a viable long-term option as a LOOGY. The first half of Rogers 2017, however, would call that conclusion into question. 2017: A Tale of two Halves "It was the best of times, it was the worst of times." Words from Charles Dickens which are applicable to Rogers’ 2017. First Half: 1.87 BB/9, 0.80 HR/9, .333 SLG Second Half: 5.73 BB/9, 1.23 HR/9, .434 SLG In the first half of the 2017 season, the Twins bullpen was in flux. Not only did the big league club use a record 16 starting pitchers over the course of the season, a slew of Quadruple-A types saw time in the pen. With a stable bullpen, Rogers would likely have faced predominantly LHH. The Twins were struggling, however, and Rogers began to see RHH with increasing frequency. Surprisingly, he delivered in a big way. Prior to the end of June, Rogers managed an incredible 1.35 ERA against RHH, with a stingy .257 SLG, and .227 BAA. For the Twins, this was a boon of Hildenbergian proportions. In the first half of 2017, Rogers threw to 33% more RHH than LHH. That split evened in the second half of the season, but not significantly enough to prevent a major regression against righties, evidenced by his 5.79 ERA, .355 BAA and .581 SLG the rest of the way against RHH. It’s almost a certainty that Rogers’ first half numbers against RHH were an aberration. A return to dominance against LHH (he had been solid but unspectacular against them in the first half) helped mitigate the damage of an awful second half. All in all Rogers finished the season with numbers which would lead most to consider him a left-handed specialist. Rogers offers more than Buddy Boshers, but not a ton more. Pitch Mix Overview Rogers’ pitch mix is important to understanding why he suddenly fell off a cliff against RHH in the second half of 2017. Rogers relies on a sinker, four seam fastball, and a curveball. Additionally, he mixes in a changeup pretty infrequently (only 4% of the time in 2017). Rogers has above average velocity on most of his pitches, his fastball generating a ton of fly balls, and his changeup generating a decent number of groundballs. Rogers decreased his chageup usage as the 2017 season progressed, ditching the pitch altogether in July. Coincidentally, that was his worst month of the year. He got it to the tune of an ERA of 8.18 and gave up a .614 SLG that month. This makes sense. The changeup is an equalizing pitch to throw to opposite handed hitters (that’s why Johan Santana was so dominant). Despite not having a great changeup to begin with, Rogers was continually being put in tough situations against RHH without a weapon to neutralize them. This, in addition to an uncharacteristically high walk rate, led Rogers to an awful second half. Waiting in the Wings On one hand, there is reason for optimism for Rogers in 2018. Despite having a pretty rough spring training, it’s likely that his elevated walk rate from the second half of the season is a mechanical issue which is now resolved (two walks in 11 IP in spring training suggest as much). On the other hand, his splits are real, Rogers might not be a true LOOGY, but he isn’t a pitcher the Twins should be relying on to get out RHH on a consistent basis. Additionally, the Twins have some interesting arms waiting in the wings. Gabriel Moya (owner of an excellent changeup) is a candidate much more likely to be successful against both LHH and RHH due to his pitch mix and deceptive mechanics. Tyler Jay is another candidate to be a back end bullpen option if he can stay healthy throughout the 2018 season. If either of those pitchers have strong seasons, they may challenge for Rogers’ spot. Zach Duke is already a better iteration of a LHP who can dominate LHH due to his ability to generate ground balls instead of fly-balls. With a minor league option remaining, don’t be surprised if Rogers ends up in Rochester if he doesn’t get off to a strong start.
-
A Tale of Two Halves: Taylor Rogers' Keys to Success
Jamie Cameron posted a blog entry in Curveball Blog
If there is one thing we can all agree on regarding the 2018 Minnesota Twins, it’s that they have a higher floor than their 2017 counterparts. With key additions in the rotation, bullpen, and at DH, Minnesota baseball fans are eagerly anticipating the start of a new season. With a higher floor, established pieces are going to have to maintain, or raise the level of their game in order to keep their jobs. Most notably; Taylor Rogers. Rogers was drafted by the Twins in the 11th round in 2012 out of the University of Kentucky. Rogers exceeded rookie limits in the 2016 season and is not eligible for arbitration until 2020. With that amount of team control its important the Twins what they have, and what they don’t have in the 27 year old left-hander. MLB Debut Rogers made his MLB debut in 2016, pitching 61 innings and excelled. Rogers managed a 3.96 ERA on the back of a 9.39 K/9, 2.35 BB/9, and GB% of 51%, all really solid numbers. Rogers’ xFIP of 3.47 was indicative that he might be scratching the surface of being an excellent relief option for the Twins. Perhaps unsurprisingly, Rogers had pretty dramatic splits in 2016. Against lefties, he put together an excellent .202 BAA, .286 SLG, and .281 BAbip. Conversely, Rogers struggled against righties, to the tune of a .291 BAA, .462 SLG, and .348 BAbip. This led most to the conclusion that Rogers could be a viable long term option as a LOOGY. The first half of Rogers 2017 however, would call that conclusion into question. 2017: A Tale of two Halves ‘It was the best of times, it was the worst of times’. Words from Charles Dickens which are applicable to Rogers’ 2017, which oscillated between impressive, and desolate. First Half: 1.87 BB/9, 0.80 HR/9, .333 SLG Second Half: 5.73 BB/9, 1.23 HR/9, .434 SLG In the first half of the 2017 season, the Twins bullpen was in flux. Not only did the big league club use a record 16 starting pitchers over the course of the season, a slew of quadruple A types saw time in the pen, long before an incredible second half surge propelled the team to the second wild card berth. With a stable bullpen, Rogers would likely faced predominantly LHH. The Twins however, were struggling, and Rogers began to see RHH with increasing frequency. Surprisingly, he delivered in a big way. Prior to the end of June, Rogers managed an incredible 1.35 ERA against RHH, with a stingy .257 SLG, and .227 BAA. For the Twins, this was a boon of Hildenbergian proportions. Overall, in the first half of 2017, Rogers threw to 33% more RHH than LHH, a statistic which evened in the second half of the season, but not significantly enough to prevent a major regression against righties, evidenced by his 5.79 ERA, .355 BAA, and .581 SLG the rest of the way against RHH. It’s almost a certainty that Rogers’ first half numbers against RHH were an aberration. A return to dominance against LHH (he had been solid but unspectacular against them in the first half) helped mitigate the damage of an awful second half. All in all Rogers finished the season with number which would lead most to consider him a left-handed specialist. Rogers offers more than Buddy Boshers, but not a ton more. Pitch Mix Overview Rogers’ pitch mix is important to understanding why he suddenly fell off a cliff against RHH in the second half of 2017. Rogers relies on a sinker, four seam fastball, and a curveball. Additionally, he mixes in a changeup pretty infrequently (only 4% of the time in 2017). Rogers has above average velocity on most of his pitches, his fastball generating a ton of fly balls, and his changeup generating a decent number of groundballs. Rogers threw his changeup minimally to begin with but decreasingly frequently as the 2017 season progressed, ditching the pitch altogether in July. Coincidentally, July was the worst month of the year for Rogers, who put together an ERA of 8.18 and gave up a .614 SLG that month. This makes sense. The changeup is an equalizing pitch to throw to opposite handed hitters (that’s why Johan Santana was so dominant). Despite not having a great changeup to begin with, Rogers was continually being put in tough situations against RHH without a weapon to neutralize them. This, in addition to an uncharacteristically high walk rate, led Rogers to an awful second half. Waiting in the Wings On one hand, there is reason for optimism for Rogers in 2018. Despite having a pretty rough spring training, it’s likely that his elevated walk rate from the second half of the season is a mechanical issue which is now resolved (2 walks in 11 IP in spring training would suggest as much). On the other hand, his splits are real, Rogers might not be a true LOOGY, but he isn’t a pitcher the Twins should be relying on to get out RHH on a consistent basis. Additionally, the Twins have some interesting arms waiting in the wings. Gabriel Moya (owner of an excellent changeup) is a candidate much more likely to be successful against both LHH and RHH due to his pitch mix and deceptive mechanics. Tyler Jay is another candidate to be a backend bullpen option if he can stay healthy throughout the 2018 season. If either of those pitchers have strong seasons, they may challenge for Rogers’ spot. Zach Duke is already a better iteration of a LHP who can dominate LHH due to his ability to generate ground balls instead of fly-balls. With a minor league option remaining, don’t be surprised if Rogers ends up in Rochester if he doesn’t get off to a strong start. -
Can Ryan Pressly Put It All Together?
Jamie Cameron replied to Jamie Cameron's topic in Twins Daily Front Page News
Thank you! I would agree. I think Pressly at his best has all the tools necessary to be a guy the Twins use in pretty high leverage situations. If he struggles with consistency, thankfully they have the bullpen depth to absorb that now. -
Can Ryan Pressly Put It All Together?
Jamie Cameron replied to Jamie Cameron's topic in Twins Daily Front Page News
Thanks for taking the time to read it! -
Can Ryan Pressly Put It All Together?
Jamie Cameron replied to Jamie Cameron's topic in Twins Daily Front Page News
Thank you! I definitely think he has the ability to be a good reliever, mid 3s ERA, lots of Ks. -
Can Ryan Pressly Put It All Together?
Jamie Cameron replied to Jamie Cameron's topic in Twins Daily Front Page News
Thank you for reading. The data is truly amazing. It's really fun looking for patterns and stories in it. That is much more work than the actual writing itself. This took me 1-2 hours, but it was fairly limited in its scope.
