

John Foley
-
Posts
36 -
Joined
-
Last visited
Content Type
Profiles
News
Minnesota Twins Videos
2026 Minnesota Twins Top Prospects Ranking
2022 Minnesota Twins Draft Picks
Minnesota Twins Free Agent & Trade Rumors, Notes, & Tidbits
Guides & Resources
2023 Minnesota Twins Draft Picks
The Minnesota Twins Players Project
2024 Minnesota Twins Draft Picks
2025 Minnesota Twins Draft Pick Tracker
2026 Minnesota Twins Draft Tracker: Picks & Bonuses
Forums
Blogs
Events
Store
Downloads
Gallery
Everything posted by John Foley
-
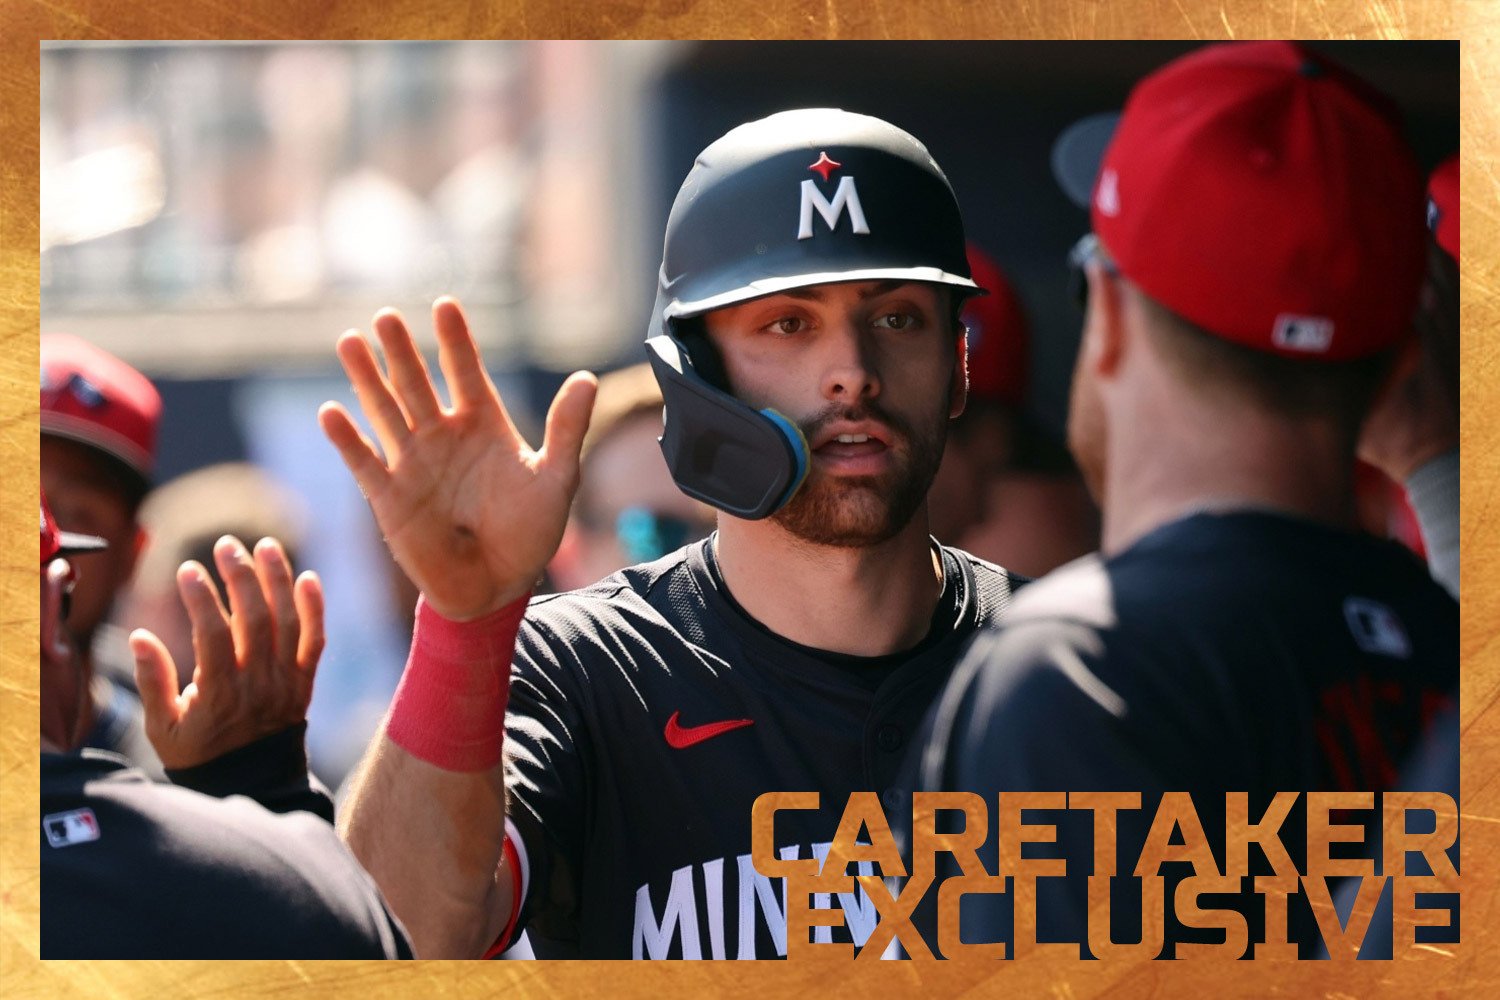
 Research indicates managers don’t have as much impact on outcomes as you might think. Let’s evaluate how Minnesota's skipper's work stacks up in the modern game. Image courtesy of © Kim Klement Neitzel-Imagn Images Welcome to the 2025 Offseason Handbook! This year, we’re offering the format online only through our Caretakers program. The Offseason Handbook is a comprehensive look at what challenges the Twins face in the coming winter to field a competitive team in 2025. To become a Caretaker, visit this page. On top of receiving exclusive access to the Offseason Handbook, Caretakers also receive in-depth analysis from national writers you cannot find anywhere else. You will also receive exclusive access to events and an ad-free browsing option. In celebration of the Offseason Handbook’s release, we’re offering 20% off all Caretaker programs for the next week. Use the code HANDBOOK at checkout to receive 20% off your purchase! When a team underachieves and fails to meet expectations, the public discourse and attention quickly turn to the job performance and security of the club’s field manager. That often includes widespread calls for the manager to be fired, as though the manager is directly and solely responsible for the team’s disappointing performance. With the Twins falling short of the playoffs because of a late-season collapse—for the second time in three seasons—the chorus to replace Rocco Baldelli reached a new octave. But, the club quickly squashed that idea, announcing on the season’s last day that Baldelli would be back as manager in 2025, albeit with some changes to his coaching staff. If our comment sections are a reliable indicator, it seems most of the Twins faithful have already definitively made up their mind about Baldelli’s work, one way or another. And, with six seasons in the dugout, there is plenty of work on which to base those judgments. After all, criticizing and second-guessing the manager of the Local Nine is as interwoven into the fabric of baseball as hot dogs and the crack of the bat. Today, I want to try a more rigorous evaluation of Baldelli’s work at the helm of the Twins. What does research tell us about the impact of a manager? And what does the data reveal about Baldelli’s decision-making, in particular? With this, I don’t have any aspirations of advocating for or against the Twins' decision to retain Baldelli for next season. Nor do I seek to try to convince any fans that they should change their viewpoint. I hope to express a framework for more objectively judging a manager’s work in the modern game, and investigate how Baldelli stacks up among his peers. View full article
 -
Offseason Handbook: An Attempt to Objectively Evaluate Rocco Baldelli
John Foley posted an article in Caretakers
.png.e5c498e7d2eabdcd708717f9ef165d8a.png) Welcome to the 2025 Offseason Handbook! This year, we’re offering the format online only through our Caretakers program. The Offseason Handbook is a comprehensive look at what challenges the Twins face in the coming winter to field a competitive team in 2025. To become a Caretaker, visit this page. On top of receiving exclusive access to the Offseason Handbook, Caretakers also receive in-depth analysis from national writers you cannot find anywhere else. You will also receive exclusive access to events and an ad-free browsing option. In celebration of the Offseason Handbook’s release, we’re offering 20% off all Caretaker programs for the next week. Use the code HANDBOOK at checkout to receive 20% off your purchase! When a team underachieves and fails to meet expectations, the public discourse and attention quickly turn to the job performance and security of the club’s field manager. That often includes widespread calls for the manager to be fired, as though the manager is directly and solely responsible for the team’s disappointing performance. With the Twins falling short of the playoffs because of a late-season collapse—for the second time in three seasons—the chorus to replace Rocco Baldelli reached a new octave. But, the club quickly squashed that idea, announcing on the season’s last day that Baldelli would be back as manager in 2025, albeit with some changes to his coaching staff. If our comment sections are a reliable indicator, it seems most of the Twins faithful have already definitively made up their mind about Baldelli’s work, one way or another. And, with six seasons in the dugout, there is plenty of work on which to base those judgments. After all, criticizing and second-guessing the manager of the Local Nine is as interwoven into the fabric of baseball as hot dogs and the crack of the bat. Today, I want to try a more rigorous evaluation of Baldelli’s work at the helm of the Twins. What does research tell us about the impact of a manager? And what does the data reveal about Baldelli’s decision-making, in particular? With this, I don’t have any aspirations of advocating for or against the Twins' decision to retain Baldelli for next season. Nor do I seek to try to convince any fans that they should change their viewpoint. I hope to express a framework for more objectively judging a manager’s work in the modern game, and investigate how Baldelli stacks up among his peers.
Welcome to the 2025 Offseason Handbook! This year, we’re offering the format online only through our Caretakers program. The Offseason Handbook is a comprehensive look at what challenges the Twins face in the coming winter to field a competitive team in 2025. To become a Caretaker, visit this page. On top of receiving exclusive access to the Offseason Handbook, Caretakers also receive in-depth analysis from national writers you cannot find anywhere else. You will also receive exclusive access to events and an ad-free browsing option. In celebration of the Offseason Handbook’s release, we’re offering 20% off all Caretaker programs for the next week. Use the code HANDBOOK at checkout to receive 20% off your purchase! When a team underachieves and fails to meet expectations, the public discourse and attention quickly turn to the job performance and security of the club’s field manager. That often includes widespread calls for the manager to be fired, as though the manager is directly and solely responsible for the team’s disappointing performance. With the Twins falling short of the playoffs because of a late-season collapse—for the second time in three seasons—the chorus to replace Rocco Baldelli reached a new octave. But, the club quickly squashed that idea, announcing on the season’s last day that Baldelli would be back as manager in 2025, albeit with some changes to his coaching staff. If our comment sections are a reliable indicator, it seems most of the Twins faithful have already definitively made up their mind about Baldelli’s work, one way or another. And, with six seasons in the dugout, there is plenty of work on which to base those judgments. After all, criticizing and second-guessing the manager of the Local Nine is as interwoven into the fabric of baseball as hot dogs and the crack of the bat. Today, I want to try a more rigorous evaluation of Baldelli’s work at the helm of the Twins. What does research tell us about the impact of a manager? And what does the data reveal about Baldelli’s decision-making, in particular? With this, I don’t have any aspirations of advocating for or against the Twins' decision to retain Baldelli for next season. Nor do I seek to try to convince any fans that they should change their viewpoint. I hope to express a framework for more objectively judging a manager’s work in the modern game, and investigate how Baldelli stacks up among his peers. -
The fastball misses being more variable, and the more frequent glove-side targeting, probably had some knock-on effects on his secondaries, which were also less effective last season (at least in terms of run value). They also drew less chase and whiff out of the zone than before. If he's spraying the fastball, it's probably not going to tunnel as well with his curveball and splitter, making all of them a bit easier to discern from each other.
-
.png.c3544b02621fa7db4c3e041764b51391.png) There’s a credible argument that, in some measure, Pablo López’s rough first half was not fully deserved. Through the All-Star break in mid-July, he had pitched to a disappointing 5.11 ERA over 104 innings. That really wasn't a fair reflection of the skill or value of a pitcher who had struck out 27.9% and walked just 5.3% of the batters he’d faced. The 22.6-point delta between López’s strikeouts and walks, usually one of the best predictors of future run prevention, was the 8th-best among 68 qualified pitchers at the time. Yet, his ERA was 65th among that same group. The most straightforward explanation for that disconnect is that López allowed 18 home runs in the first half, tied for 4th-most on the list. His rate of 1.6 home runs allowed per nine innings in the first half was well above his 1.1 per nine career norm, pushed up by the league’s second-highest home runs-per-fly ball rate (15.8%). The issue with long balls was compounded by poor sequencing luck — he stranded only 65.5% of the baserunners he allowed to reach, about 8 points below his norm, and the 5th-lowest rate on the aforementioned list. López’s fielding independent pitching (FIP) estimate at that point was a solid enough 3.84, and the 1.26-run gap between his actual ERA and his FIP was MLB’s 2nd-largest. It was clear he wasn’t pitching as poorly as his top-line numbers indicated, but it was also clear that he was not pitching as well as he did last year, when he ascended to the top of the Twins’ rotation. Misfortune had a role, but López was also getting hit harder, more often. His exit velocity allowed, hard-hit rate, barrel rate, and expected production on contact numbers had all trended the wrong way compared to last season. His sweeper, a key to last season’s rise, and his always highly regarded changeup were both returning negative results. Something needed to change. Now, through August, López has thrown three scoreless outings in a row (part of a 20 2/3-inning scoreless streak), which have punctuated a run of great work since the All-Star break. He’s worked to a 1.92 ERA over 51 2/3 innings in the 2nd half, which has whittled his seasonal mark down to 4.05. More importantly, he’s again suppressing hard contact and keeping the ball in the yard. Something has changed. Let’s dive in on what. Things Tend to Even Out Let’s start with the easy ones that don’t require much #analysis. López’s batted-ball and sequencing luck have turned in his favor. In the second half, his batting average allowed on balls in play (BABIP) is down about 35 points, to .268, and he’s stranded 87.3% of the runners he’s allowed. Just 9.3% of his fly balls have carried over the fence. The early season misfortune has swung the other way. López’s slugging percentage allowed is about 80 points lower in the second half, which is certainly aided by giving up fewer homers, but also by giving up lower-quality contact to opposing hitters. His opponents' average exit velocity is more in line with last season, down to 86.6 mph from 88.2 mph, and almost half of that contact has been on the ground (up from just under 40% in the first half), where extra bases are hard to come by. What’s changed to enable that?
There’s a credible argument that, in some measure, Pablo López’s rough first half was not fully deserved. Through the All-Star break in mid-July, he had pitched to a disappointing 5.11 ERA over 104 innings. That really wasn't a fair reflection of the skill or value of a pitcher who had struck out 27.9% and walked just 5.3% of the batters he’d faced. The 22.6-point delta between López’s strikeouts and walks, usually one of the best predictors of future run prevention, was the 8th-best among 68 qualified pitchers at the time. Yet, his ERA was 65th among that same group. The most straightforward explanation for that disconnect is that López allowed 18 home runs in the first half, tied for 4th-most on the list. His rate of 1.6 home runs allowed per nine innings in the first half was well above his 1.1 per nine career norm, pushed up by the league’s second-highest home runs-per-fly ball rate (15.8%). The issue with long balls was compounded by poor sequencing luck — he stranded only 65.5% of the baserunners he allowed to reach, about 8 points below his norm, and the 5th-lowest rate on the aforementioned list. López’s fielding independent pitching (FIP) estimate at that point was a solid enough 3.84, and the 1.26-run gap between his actual ERA and his FIP was MLB’s 2nd-largest. It was clear he wasn’t pitching as poorly as his top-line numbers indicated, but it was also clear that he was not pitching as well as he did last year, when he ascended to the top of the Twins’ rotation. Misfortune had a role, but López was also getting hit harder, more often. His exit velocity allowed, hard-hit rate, barrel rate, and expected production on contact numbers had all trended the wrong way compared to last season. His sweeper, a key to last season’s rise, and his always highly regarded changeup were both returning negative results. Something needed to change. Now, through August, López has thrown three scoreless outings in a row (part of a 20 2/3-inning scoreless streak), which have punctuated a run of great work since the All-Star break. He’s worked to a 1.92 ERA over 51 2/3 innings in the 2nd half, which has whittled his seasonal mark down to 4.05. More importantly, he’s again suppressing hard contact and keeping the ball in the yard. Something has changed. Let’s dive in on what. Things Tend to Even Out Let’s start with the easy ones that don’t require much #analysis. López’s batted-ball and sequencing luck have turned in his favor. In the second half, his batting average allowed on balls in play (BABIP) is down about 35 points, to .268, and he’s stranded 87.3% of the runners he’s allowed. Just 9.3% of his fly balls have carried over the fence. The early season misfortune has swung the other way. López’s slugging percentage allowed is about 80 points lower in the second half, which is certainly aided by giving up fewer homers, but also by giving up lower-quality contact to opposing hitters. His opponents' average exit velocity is more in line with last season, down to 86.6 mph from 88.2 mph, and almost half of that contact has been on the ground (up from just under 40% in the first half), where extra bases are hard to come by. What’s changed to enable that? -
The Twins need a stopper this afternoon in Tampa Bay, and fortunately, that's exactly what they have. After an uneven first half, Pablo López has looked like the Ace the Twins need, thanks to a few tweaks and some better fortune. Image courtesy of © Bruce Kluckhohn-Imagn Images There’s a credible argument that, in some measure, Pablo López’s rough first half was not fully deserved. Through the All-Star break in mid-July, he had pitched to a disappointing 5.11 ERA over 104 innings. That really wasn't a fair reflection of the skill or value of a pitcher who had struck out 27.9% and walked just 5.3% of the batters he’d faced. The 22.6-point delta between López’s strikeouts and walks, usually one of the best predictors of future run prevention, was the 8th-best among 68 qualified pitchers at the time. Yet, his ERA was 65th among that same group. The most straightforward explanation for that disconnect is that López allowed 18 home runs in the first half, tied for 4th-most on the list. His rate of 1.6 home runs allowed per nine innings in the first half was well above his 1.1 per nine career norm, pushed up by the league’s second-highest home runs-per-fly ball rate (15.8%). The issue with long balls was compounded by poor sequencing luck — he stranded only 65.5% of the baserunners he allowed to reach, about 8 points below his norm, and the 5th-lowest rate on the aforementioned list. López’s fielding independent pitching (FIP) estimate at that point was a solid enough 3.84, and the 1.26-run gap between his actual ERA and his FIP was MLB’s 2nd-largest. It was clear he wasn’t pitching as poorly as his top-line numbers indicated, but it was also clear that he was not pitching as well as he did last year, when he ascended to the top of the Twins’ rotation. Misfortune had a role, but López was also getting hit harder, more often. His exit velocity allowed, hard-hit rate, barrel rate, and expected production on contact numbers had all trended the wrong way compared to last season. His sweeper, a key to last season’s rise, and his always highly regarded changeup were both returning negative results. Something needed to change. Now, through August, López has thrown three scoreless outings in a row (part of a 20 2/3-inning scoreless streak), which have punctuated a run of great work since the All-Star break. He’s worked to a 1.92 ERA over 51 2/3 innings in the 2nd half, which has whittled his seasonal mark down to 4.05. More importantly, he’s again suppressing hard contact and keeping the ball in the yard. Something has changed. Let’s dive in on what. Things Tend to Even Out Let’s start with the easy ones that don’t require much #analysis. López’s batted-ball and sequencing luck have turned in his favor. In the second half, his batting average allowed on balls in play (BABIP) is down about 35 points, to .268, and he’s stranded 87.3% of the runners he’s allowed. Just 9.3% of his fly balls have carried over the fence. The early season misfortune has swung the other way. López’s slugging percentage allowed is about 80 points lower in the second half, which is certainly aided by giving up fewer homers, but also by giving up lower-quality contact to opposing hitters. His opponents' average exit velocity is more in line with last season, down to 86.6 mph from 88.2 mph, and almost half of that contact has been on the ground (up from just under 40% in the first half), where extra bases are hard to come by. What’s changed to enable that? View full article
-
I love that this article linked to a left-handed pitcher from 1885 with my name. I threw right-handed 120 years later, alas.
-
The Twins had faith he would find the right adjustments. For the most part, they have been right. Image courtesy of © Rick Osentoski-USA TODAY Sports After back-to-back tough outings against Colorado in mid-June, trusty reliever Caleb Thielbar had an ugly 8.04 ERA, 5.09 FIP, and the worst context-adjusted win probability added (WPA/LI, -0.73) mark of any Twins pitcher this season. That rough start to the season left many wondering if this was the end for the 37-year-old left-hander. On one hand, there was a case to be made for bad luck in a small sample. Relief pitching is notoriously volatile, and in a tiny 15 2/3-inning sample to that point, Thielbar’s batting average allowed on balls in play was a comically high .412. He’d only stranded 52.1% of the baserunners he’d allowed, far below his nearly 75% career average. Plus, Thielbar’s fastball velocity was a career-best. Velocity isn’t everything, but it’s a lot, and Thielbar’s heat this season ran contrary to the thought that Father Time was finally starting to have his way. On the other hand, there were also signs of skill erosion. Thielbar’s command of his breaking ball-heavy arsenal was much more wobbly than usual, with fewer pitches in the strike zone and an unsightly 11.1% walk rate. His strikeout rate had plummeted to 22%, well below the 30-ish percent rates he’d run previously, thanks to a significant decline in his ability to draw empty swings. The public-facing pitch quality models supported these declines and graded Thielbar’s arsenal meaningfully lower than before. The bottom hadn’t fallen out like some of the online discourse may have led you to believe. The quality of his stuff was still league-average or slightly better for a left-hander, but Thielbar’s margin for error had shrunk, and future success was going to require some adjustments and much sharper execution. For their part, the Twins' brain trust espoused confidence Thielbar would find his way: Fast-forward a month and a half, and Thielbar has shown signs of looking a lot like his old self, Sunday’s difficult outing notwithstanding. Following his crucial six-up, six-down outing last Friday night to help the Twins sweep a doubleheader from first-place Cleveland, Meat Raffle had a 2.81 ERA and 2.55 FIP over his last 16 innings, spanning back to Jun. 20. Better yet, he’d struck out 28.8% of the batters he’d faced in that span, while walking a more stingy 7.6%. Missing bats, limiting walks, and a .268 BABIP and 76.9% strand rate that were not unusually fortunate support the idea that Thielbar has figured something out. What Changed? View full article
-
The Key to Twins Lefty Caleb Thielbar's Midseason Turnaround
John Foley posted an article in Caretakers
.png.f275120a6304d4042e6f591aa31c0870.png) After back-to-back tough outings against Colorado in mid-June, trusty reliever Caleb Thielbar had an ugly 8.04 ERA, 5.09 FIP, and the worst context-adjusted win probability added (WPA/LI, -0.73) mark of any Twins pitcher this season. That rough start to the season left many wondering if this was the end for the 37-year-old left-hander. On one hand, there was a case to be made for bad luck in a small sample. Relief pitching is notoriously volatile, and in a tiny 15 2/3-inning sample to that point, Thielbar’s batting average allowed on balls in play was a comically high .412. He’d only stranded 52.1% of the baserunners he’d allowed, far below his nearly 75% career average. Plus, Thielbar’s fastball velocity was a career-best. Velocity isn’t everything, but it’s a lot, and Thielbar’s heat this season ran contrary to the thought that Father Time was finally starting to have his way. On the other hand, there were also signs of skill erosion. Thielbar’s command of his breaking ball-heavy arsenal was much more wobbly than usual, with fewer pitches in the strike zone and an unsightly 11.1% walk rate. His strikeout rate had plummeted to 22%, well below the 30-ish percent rates he’d run previously, thanks to a significant decline in his ability to draw empty swings. The public-facing pitch quality models supported these declines and graded Thielbar’s arsenal meaningfully lower than before. The bottom hadn’t fallen out like some of the online discourse may have led you to believe. The quality of his stuff was still league-average or slightly better for a left-hander, but Thielbar’s margin for error had shrunk, and future success was going to require some adjustments and much sharper execution. For their part, the Twins' brain trust espoused confidence Thielbar would find his way: Fast-forward a month and a half, and Thielbar has shown signs of looking a lot like his old self, Sunday’s difficult outing notwithstanding. Following his crucial six-up, six-down outing last Friday night to help the Twins sweep a doubleheader from first-place Cleveland, Meat Raffle had a 2.81 ERA and 2.55 FIP over his last 16 innings, spanning back to Jun. 20. Better yet, he’d struck out 28.8% of the batters he’d faced in that span, while walking a more stingy 7.6%. Missing bats, limiting walks, and a .268 BABIP and 76.9% strand rate that were not unusually fortunate support the idea that Thielbar has figured something out. What Changed?
After back-to-back tough outings against Colorado in mid-June, trusty reliever Caleb Thielbar had an ugly 8.04 ERA, 5.09 FIP, and the worst context-adjusted win probability added (WPA/LI, -0.73) mark of any Twins pitcher this season. That rough start to the season left many wondering if this was the end for the 37-year-old left-hander. On one hand, there was a case to be made for bad luck in a small sample. Relief pitching is notoriously volatile, and in a tiny 15 2/3-inning sample to that point, Thielbar’s batting average allowed on balls in play was a comically high .412. He’d only stranded 52.1% of the baserunners he’d allowed, far below his nearly 75% career average. Plus, Thielbar’s fastball velocity was a career-best. Velocity isn’t everything, but it’s a lot, and Thielbar’s heat this season ran contrary to the thought that Father Time was finally starting to have his way. On the other hand, there were also signs of skill erosion. Thielbar’s command of his breaking ball-heavy arsenal was much more wobbly than usual, with fewer pitches in the strike zone and an unsightly 11.1% walk rate. His strikeout rate had plummeted to 22%, well below the 30-ish percent rates he’d run previously, thanks to a significant decline in his ability to draw empty swings. The public-facing pitch quality models supported these declines and graded Thielbar’s arsenal meaningfully lower than before. The bottom hadn’t fallen out like some of the online discourse may have led you to believe. The quality of his stuff was still league-average or slightly better for a left-hander, but Thielbar’s margin for error had shrunk, and future success was going to require some adjustments and much sharper execution. For their part, the Twins' brain trust espoused confidence Thielbar would find his way: Fast-forward a month and a half, and Thielbar has shown signs of looking a lot like his old self, Sunday’s difficult outing notwithstanding. Following his crucial six-up, six-down outing last Friday night to help the Twins sweep a doubleheader from first-place Cleveland, Meat Raffle had a 2.81 ERA and 2.55 FIP over his last 16 innings, spanning back to Jun. 20. Better yet, he’d struck out 28.8% of the batters he’d faced in that span, while walking a more stingy 7.6%. Missing bats, limiting walks, and a .268 BABIP and 76.9% strand rate that were not unusually fortunate support the idea that Thielbar has figured something out. What Changed? -
Defensive measures are noisy and take a long time to become reliable. One detail point of clarification is that Statcast measures from where the player is positioned. If the pre-pitch positioning makes the play easier for the player, they get less credit for successfully making it. If that positioning makes it harder, they get more credit if they convert it. The other defensive measurement systems don't handle pre-pitch positioning as precisely as Statcast.
-
How Carlos Santana Has Turned Back the Clock for the Twins
John Foley posted an article in Caretakers
.png.d1898abfeb2e4642f55011a8c5de2e3e.png) Over at FanGraphs, Jay Jaffe started his trade deadline preview with articles identifying the roster holes contending teams might be looking to upgrade. Jaffe started his series this year with first base, and the piece was notable for this community, in that it did not include the Twins. Not only has first base not been a problem for the Twins, it’s been surprisingly solid. The Twins’ 1.9 fWAR from first base is the 6th-highest total for that position in MLB this season. If I had told you before the season began that first base would be a source of strength at the All-Star break, you might have assumed that meant Alex Kirilloff had leaped forward. That has not been the case, with Kirilloff some combination of scuffling and injured. Instead, that first base production has mostly been provided by Carlos Santana, the 38-year-old journeyman on his sixth team in the last five seasons. Jest clear of the break, the always-durable Santana has played in 91 of the team’s 98 games, with 81 starts at first base. He’s been far more than just an available warm body, however, with a slash line of .241/.325/.429 which is 15 percent above league average by wRC+. Add in defense that Statcast places in the 93rd percentile (+6 fielding run value), and Santana has already racked up his highest seasonal WAR total since 2019, when he was an All-Star with Cleveland and finished 16th in American League MVP voting. In the context of the rest of the league’s first basemen, Santana’s WAR is tied for 5th in MLB (and tied for 1st in the AL) with Cleveland’s Josh Naylor. While his glove is a big piece of that value puzzle, Santana’s bat work also ranks 9th among all first sackers (and 3rd in the AL) in wOBA (.326) and wRC+ (115). That means the Twins have already more than broken even on their modest $5.25 million offseason investment in Santana’s services. FanGraphs estimates that Santana has already provided $13.6 million worth of value this season. That’s all well and good, but it's fair to wonder how Santana is doing this. It’s certainly not unheard of for a player to outrun Father Time as they approach their 40th birthday (Nelson Cruz, anyone?), but it is unusual. That’s especially the case for Santana, whom the esteemed Ben Clemens of FanGraphs was calling cooked nearly three full seasons ago — which is to say nothing of the April 2024 Twins Twitterati — and whose bat has not been meaningfully above-average in five seasons. Is his first half a nice run of good fortune, or might it have legs down the stretch? The Usual Suspects Whenever I want to understand what’s driving a hitter’s hot stretch, I often start the evaluation by checking their plate discipline, batted-ball luck, and batted-ball quality metrics. Has their ability to choose pitches to swing at changed? Have they gotten abnormally fortunate with batted balls landing for hits or over the fence for home runs? Are they hitting the ball harder or on more optimal angles? Comparing Santana’s first half to the last few seasons doesn’t reveal that he’s having abnormally good luck or made any major gains in discipline or batted ball quality. Take a look: You’re welcome to look across those figures and see if you find any patterns. He’s walking less often than before, but hasn’t struck out more often. The BABIP row shows Santana is a beneficiary of the defensive shift ban, but his .258 mark this year is perfectly in line with his career norms. His average launch angle is up, but it’s close to what he had in 2022 and may be worth exploring further. You can squint and say he’s swinging and missing a bit more often, but it doesn’t seem much out of line with the recent past. We’ll have to keep looking.
Over at FanGraphs, Jay Jaffe started his trade deadline preview with articles identifying the roster holes contending teams might be looking to upgrade. Jaffe started his series this year with first base, and the piece was notable for this community, in that it did not include the Twins. Not only has first base not been a problem for the Twins, it’s been surprisingly solid. The Twins’ 1.9 fWAR from first base is the 6th-highest total for that position in MLB this season. If I had told you before the season began that first base would be a source of strength at the All-Star break, you might have assumed that meant Alex Kirilloff had leaped forward. That has not been the case, with Kirilloff some combination of scuffling and injured. Instead, that first base production has mostly been provided by Carlos Santana, the 38-year-old journeyman on his sixth team in the last five seasons. Jest clear of the break, the always-durable Santana has played in 91 of the team’s 98 games, with 81 starts at first base. He’s been far more than just an available warm body, however, with a slash line of .241/.325/.429 which is 15 percent above league average by wRC+. Add in defense that Statcast places in the 93rd percentile (+6 fielding run value), and Santana has already racked up his highest seasonal WAR total since 2019, when he was an All-Star with Cleveland and finished 16th in American League MVP voting. In the context of the rest of the league’s first basemen, Santana’s WAR is tied for 5th in MLB (and tied for 1st in the AL) with Cleveland’s Josh Naylor. While his glove is a big piece of that value puzzle, Santana’s bat work also ranks 9th among all first sackers (and 3rd in the AL) in wOBA (.326) and wRC+ (115). That means the Twins have already more than broken even on their modest $5.25 million offseason investment in Santana’s services. FanGraphs estimates that Santana has already provided $13.6 million worth of value this season. That’s all well and good, but it's fair to wonder how Santana is doing this. It’s certainly not unheard of for a player to outrun Father Time as they approach their 40th birthday (Nelson Cruz, anyone?), but it is unusual. That’s especially the case for Santana, whom the esteemed Ben Clemens of FanGraphs was calling cooked nearly three full seasons ago — which is to say nothing of the April 2024 Twins Twitterati — and whose bat has not been meaningfully above-average in five seasons. Is his first half a nice run of good fortune, or might it have legs down the stretch? The Usual Suspects Whenever I want to understand what’s driving a hitter’s hot stretch, I often start the evaluation by checking their plate discipline, batted-ball luck, and batted-ball quality metrics. Has their ability to choose pitches to swing at changed? Have they gotten abnormally fortunate with batted balls landing for hits or over the fence for home runs? Are they hitting the ball harder or on more optimal angles? Comparing Santana’s first half to the last few seasons doesn’t reveal that he’s having abnormally good luck or made any major gains in discipline or batted ball quality. Take a look: You’re welcome to look across those figures and see if you find any patterns. He’s walking less often than before, but hasn’t struck out more often. The BABIP row shows Santana is a beneficiary of the defensive shift ban, but his .258 mark this year is perfectly in line with his career norms. His average launch angle is up, but it’s close to what he had in 2022 and may be worth exploring further. You can squint and say he’s swinging and missing a bit more often, but it doesn’t seem much out of line with the recent past. We’ll have to keep looking. -
The veteran first baseman hasn’t hit like this since 2019. What’s behind Santana’s late-career renaissance? Does it have legs for the second half? Image courtesy of © Matt Krohn-USA TODAY Sports Over at FanGraphs, Jay Jaffe started his trade deadline preview with articles identifying the roster holes contending teams might be looking to upgrade. Jaffe started his series this year with first base, and the piece was notable for this community, in that it did not include the Twins. Not only has first base not been a problem for the Twins, it’s been surprisingly solid. The Twins’ 1.9 fWAR from first base is the 6th-highest total for that position in MLB this season. If I had told you before the season began that first base would be a source of strength at the All-Star break, you might have assumed that meant Alex Kirilloff had leaped forward. That has not been the case, with Kirilloff some combination of scuffling and injured. Instead, that first base production has mostly been provided by Carlos Santana, the 38-year-old journeyman on his sixth team in the last five seasons. Jest clear of the break, the always-durable Santana has played in 91 of the team’s 98 games, with 81 starts at first base. He’s been far more than just an available warm body, however, with a slash line of .241/.325/.429 which is 15 percent above league average by wRC+. Add in defense that Statcast places in the 93rd percentile (+6 fielding run value), and Santana has already racked up his highest seasonal WAR total since 2019, when he was an All-Star with Cleveland and finished 16th in American League MVP voting. In the context of the rest of the league’s first basemen, Santana’s WAR is tied for 5th in MLB (and tied for 1st in the AL) with Cleveland’s Josh Naylor. While his glove is a big piece of that value puzzle, Santana’s bat work also ranks 9th among all first sackers (and 3rd in the AL) in wOBA (.326) and wRC+ (115). That means the Twins have already more than broken even on their modest $5.25 million offseason investment in Santana’s services. FanGraphs estimates that Santana has already provided $13.6 million worth of value this season. That’s all well and good, but it's fair to wonder how Santana is doing this. It’s certainly not unheard of for a player to outrun Father Time as they approach their 40th birthday (Nelson Cruz, anyone?), but it is unusual. That’s especially the case for Santana, whom the esteemed Ben Clemens of FanGraphs was calling cooked nearly three full seasons ago — which is to say nothing of the April 2024 Twins Twitterati — and whose bat has not been meaningfully above-average in five seasons. Is his first half a nice run of good fortune, or might it have legs down the stretch? The Usual Suspects Whenever I want to understand what’s driving a hitter’s hot stretch, I often start the evaluation by checking their plate discipline, batted-ball luck, and batted-ball quality metrics. Has their ability to choose pitches to swing at changed? Have they gotten abnormally fortunate with batted balls landing for hits or over the fence for home runs? Are they hitting the ball harder or on more optimal angles? Comparing Santana’s first half to the last few seasons doesn’t reveal that he’s having abnormally good luck or made any major gains in discipline or batted ball quality. Take a look: You’re welcome to look across those figures and see if you find any patterns. He’s walking less often than before, but hasn’t struck out more often. The BABIP row shows Santana is a beneficiary of the defensive shift ban, but his .258 mark this year is perfectly in line with his career norms. His average launch angle is up, but it’s close to what he had in 2022 and may be worth exploring further. You can squint and say he’s swinging and missing a bit more often, but it doesn’t seem much out of line with the recent past. We’ll have to keep looking. View full article
-
Yes, multiple peer-reviewed studies have shown velocity is a direct stressor on the elbow. I linked to a good round-up on the topic from Driveline in the article and below are a few others. It's very difficult to control for other confounding variables, so pinning the elbow injuries on any one specific thing isn't something the research has done. https://www.drivelinebaseball.com/2017/02/fastballs-offspeed-pitches-comparative-relative-elbow-stress/ https://pubmed.ncbi.nlm.nih.gov/30721094/ https://www.drivelinebaseball.com/2017/03/bullpens-tracking-elbow-torque-and-mstress/ https://pubmed.ncbi.nlm.nih.gov/26983459/
-
Every year, we get excited about pitchers who are throwing harder than before. How much on-field impact does that extra velocity (real or perceived) make? Does it make up for increased injury risk? Image courtesy of © Denny Medley-USA TODAY Sports Hope springs eternal at the start of the season. Players who have spent the winter improving themselves finally get to showcase their gains. For many position players, that often comes with proclamations that they're in "the best shape of his life.” Sometimes that is true for pitchers, but more common in recent years is “he went to Driveline” (or a similar place). For the hurlers, those winter visits to the private science-of-baseball labs might result in new or refined pitches in their arsenal. They also might result in the always-coveted increase in velocity. For the Twins this spring, starting pitchers Bailey Ober and Simeon Woods-Richardson and reliever Jorge Alcalá garnered attention with their newly augmented fastball velocity. Before that, it was Griffin Jax and Joe Ryan. While it remains to be seen if those gains will translate into regular season impact, they offer reasons to believe that the players might have another gear than they previously showed. Woods-Richardson’s velocity increase has been present in his first two starts in Triple-A, and Ober was a full tick above last year’s average in his first start, despite struggling mightily. Alcalá’s bump has come north, too, averaging 96.6 mph in his first few relief appearances. We believe that more velocity leads to better results, but is that true? What is that worth in practice? Does increased fastball velocity result in better run prevention? Is a velocity uptick more impactful for some hurlers than others? Let’s see if we can find out. Getting Grounded Velocity is increasing throughout MLB, and has been for a while. The league-average four-seamer in 2008, when pitch tracking was implemented, was 91.9 mph. Last season, it was 94.2 mph. That increase has been driven less by increasing maximum velocity (no one has topped Aroldis Chapman’s 105.8 mph from 2010), than by an increasing number of pitchers throwing hard. Sixty-four different hurlers touched 100 mph or better last season, per Statcast, and 38.0% of all four-seamers thrown were harder than 95 mph (more than double the same figure for 2008). The upper limit isn’t going up, but things are getting more crowded near it. With the help of Statcast search, I binned every four-seam fastball and sinker thrown over the last 3 seasons (2021-2023, more than 1,000,000 of them combined) into one-mile-per-hour increments. The average Major League four-seamer in that period was 93.9 mph and allowed a .256/.345/.447 triple-slash line and a .344 weighted on-base average (wOBA). Sinkers have averaged 93.2 mph, while getting hit to .283/.360/.424 and a .344 wOBA. The two dominant fastball types at the league level have allowed the same production, albeit with different shapes. Four-seamers suppress batting average and on-base percentage better than sinkers, but are more susceptible to slugging. That makes sense intuitively — sinkers tend to generate ground balls, which can sneak through infields for singles, boosting batting average and on-base percentage; and four-seamers tend to generate flyballs that are either caught for outs or go for extra bases, suppressing average and increasing slugging. Around those averages, the distribution of velocity of those pitch types at the league level looks like this: About 60% of the four-seamers thrown in the last three seasons have been between 92 and 96 miles per hour. Sinkers are just a tick lower on the velocity scale, as you can see above, and about 55% of those have fallen between 91 and 95 miles per hour. View full article
-
How Much is an Extra Mile Per Hour on Your Fastball Worth?
John Foley posted an article in Caretakers
.png.8db71c1fbfd45d93202be6f2f1153bfe.png) Hope springs eternal at the start of the season. Players who have spent the winter improving themselves finally get to showcase their gains. For many position players, that often comes with proclamations that they're in "the best shape of his life.” Sometimes that is true for pitchers, but more common in recent years is “he went to Driveline” (or a similar place). For the hurlers, those winter visits to the private science-of-baseball labs might result in new or refined pitches in their arsenal. They also might result in the always-coveted increase in velocity. For the Twins this spring, starting pitchers Bailey Ober and Simeon Woods-Richardson and reliever Jorge Alcalá garnered attention with their newly augmented fastball velocity. Before that, it was Griffin Jax and Joe Ryan. While it remains to be seen if those gains will translate into regular season impact, they offer reasons to believe that the players might have another gear than they previously showed. Woods-Richardson’s velocity increase has been present in his first two starts in Triple-A, and Ober was a full tick above last year’s average in his first start, despite struggling mightily. Alcalá’s bump has come north, too, averaging 96.6 mph in his first few relief appearances. We believe that more velocity leads to better results, but is that true? What is that worth in practice? Does increased fastball velocity result in better run prevention? Is a velocity uptick more impactful for some hurlers than others? Let’s see if we can find out. Getting Grounded Velocity is increasing throughout MLB, and has been for a while. The league-average four-seamer in 2008, when pitch tracking was implemented, was 91.9 mph. Last season, it was 94.2 mph. That increase has been driven less by increasing maximum velocity (no one has topped Aroldis Chapman’s 105.8 mph from 2010), than by an increasing number of pitchers throwing hard. Sixty-four different hurlers touched 100 mph or better last season, per Statcast, and 38.0% of all four-seamers thrown were harder than 95 mph (more than double the same figure for 2008). The upper limit isn’t going up, but things are getting more crowded near it. With the help of Statcast search, I binned every four-seam fastball and sinker thrown over the last 3 seasons (2021-2023, more than 1,000,000 of them combined) into one-mile-per-hour increments. The average Major League four-seamer in that period was 93.9 mph and allowed a .256/.345/.447 triple-slash line and a .344 weighted on-base average (wOBA). Sinkers have averaged 93.2 mph, while getting hit to .283/.360/.424 and a .344 wOBA. The two dominant fastball types at the league level have allowed the same production, albeit with different shapes. Four-seamers suppress batting average and on-base percentage better than sinkers, but are more susceptible to slugging. That makes sense intuitively — sinkers tend to generate ground balls, which can sneak through infields for singles, boosting batting average and on-base percentage; and four-seamers tend to generate flyballs that are either caught for outs or go for extra bases, suppressing average and increasing slugging. Around those averages, the distribution of velocity of those pitch types at the league level looks like this: About 60% of the four-seamers thrown in the last three seasons have been between 92 and 96 miles per hour. Sinkers are just a tick lower on the velocity scale, as you can see above, and about 55% of those have fallen between 91 and 95 miles per hour.
Hope springs eternal at the start of the season. Players who have spent the winter improving themselves finally get to showcase their gains. For many position players, that often comes with proclamations that they're in "the best shape of his life.” Sometimes that is true for pitchers, but more common in recent years is “he went to Driveline” (or a similar place). For the hurlers, those winter visits to the private science-of-baseball labs might result in new or refined pitches in their arsenal. They also might result in the always-coveted increase in velocity. For the Twins this spring, starting pitchers Bailey Ober and Simeon Woods-Richardson and reliever Jorge Alcalá garnered attention with their newly augmented fastball velocity. Before that, it was Griffin Jax and Joe Ryan. While it remains to be seen if those gains will translate into regular season impact, they offer reasons to believe that the players might have another gear than they previously showed. Woods-Richardson’s velocity increase has been present in his first two starts in Triple-A, and Ober was a full tick above last year’s average in his first start, despite struggling mightily. Alcalá’s bump has come north, too, averaging 96.6 mph in his first few relief appearances. We believe that more velocity leads to better results, but is that true? What is that worth in practice? Does increased fastball velocity result in better run prevention? Is a velocity uptick more impactful for some hurlers than others? Let’s see if we can find out. Getting Grounded Velocity is increasing throughout MLB, and has been for a while. The league-average four-seamer in 2008, when pitch tracking was implemented, was 91.9 mph. Last season, it was 94.2 mph. That increase has been driven less by increasing maximum velocity (no one has topped Aroldis Chapman’s 105.8 mph from 2010), than by an increasing number of pitchers throwing hard. Sixty-four different hurlers touched 100 mph or better last season, per Statcast, and 38.0% of all four-seamers thrown were harder than 95 mph (more than double the same figure for 2008). The upper limit isn’t going up, but things are getting more crowded near it. With the help of Statcast search, I binned every four-seam fastball and sinker thrown over the last 3 seasons (2021-2023, more than 1,000,000 of them combined) into one-mile-per-hour increments. The average Major League four-seamer in that period was 93.9 mph and allowed a .256/.345/.447 triple-slash line and a .344 weighted on-base average (wOBA). Sinkers have averaged 93.2 mph, while getting hit to .283/.360/.424 and a .344 wOBA. The two dominant fastball types at the league level have allowed the same production, albeit with different shapes. Four-seamers suppress batting average and on-base percentage better than sinkers, but are more susceptible to slugging. That makes sense intuitively — sinkers tend to generate ground balls, which can sneak through infields for singles, boosting batting average and on-base percentage; and four-seamers tend to generate flyballs that are either caught for outs or go for extra bases, suppressing average and increasing slugging. Around those averages, the distribution of velocity of those pitch types at the league level looks like this: About 60% of the four-seamers thrown in the last three seasons have been between 92 and 96 miles per hour. Sinkers are just a tick lower on the velocity scale, as you can see above, and about 55% of those have fallen between 91 and 95 miles per hour.- 11 comments
-
- 4
-

-
- bailey ober
- simeon woods richardson
- (and 1 more)
-
That's an interesting thought. I went back and checked. The opposing starters on the all-right lineup days were: MIL Aaron Ashby in 3rd career start (29 pts of wOBA better vs. RHB career) CHC Justin Steele (no career split difference, .300 wOBA against both sides) CLE Logan Allen (two times --- 43 pts of wOBA better vs. LHB career) TOR Yusei Kikuchi (75 pts of wOBA better vs. LHB career) COL Brent Suter (as 1 IP opener --- 5 pts of wOBA better vs. RHB career)
-
Kepler's split numbers are in the 3rd paragraph and the rest of the data throughout includes all Twins left-handed batters 2021-2023.
-
Should the Twins stack their lineup with right-handed hitters against left-handed pitching? Maybe not. Let’s investigate what happens when they deploy a few left-handed bats. Image courtesy of © Kim Klement Neitzel-USA TODAY Sports Tell me if this has ever been your reaction to a Twins lineup. Let’s say they are about to play a game against a probable left-handed starting pitcher — maybe like last June 19 against Boston, or last Sept. 22 against the Angels — and their starting lineup contains multiple left-handed-hitting position players. What on Earth are they doing? Don’t they understand the platoon advantage? Don’t they realize their lefty hitters stink against lefty pitching? Often, it's Max Kepler and his career .284 wOBA and 77 wRC+ marks against left-handed pitching taking up prime lineup real estate. (Those are 53 points and 36 points worse than his performance against right-handed pitching, respectively.) Other times, it’s Kepler and another (or two) of the younger left-handed hitters, like Alex Kirilloff, Matt Wallner, Edouard Julien, or Trevor Larnach. They all theoretically could benefit long-term from reps against southpaws, but have demonstrated little to suggest they can hold their own against them in the present: Sometimes last season, it was even Joey Gallo and his greater than 40% career whiff rate against left-handed pitching. In prior seasons, it had been Jake Cave, Nick Gordon, and Luis Arráez. No matter the configuration, the results haven’t been very good. Over the past three seasons, the Twins rank 20th in overall team production (.312 wOBA) against left-handed pitching, and 17th (.323) against left-handed starting pitching. In a vacuum, including some left-handed hitters against left-handed pitching puts the Twins at a disadvantage. At the league level, the data is clear that there is a disadvantage for hitters when they are facing same-handed pitching. Since 2008, left-handed batters have performed 28 points of wOBA worse against left-handed pitching than they have against righties. But daily lineup decisions aren’t made in a vacuum. Many different variables and considerations come into play. Kepler’s valuable defense in right field is one. The injury and availability status and current composition of the rest of the roster is another. The long-term development needs of young players might be another, among many others. As ideal as it might appear to be in theory, rarely is it possible to stack the lineup with only right-handed hitters against left-handed pitching (or vice versa with left-handed hitters against right-handed pitching). View full article
- 14 replies
-
- 1
-
-
- edouard julien
- max kepler
- (and 1 more)
-
 Tell me if this has ever been your reaction to a Twins lineup. Let’s say they are about to play a game against a probable left-handed starting pitcher — maybe like last June 19 against Boston, or last Sept. 22 against the Angels — and their starting lineup contains multiple left-handed-hitting position players. What on Earth are they doing? Don’t they understand the platoon advantage? Don’t they realize their lefty hitters stink against lefty pitching? Often, it's Max Kepler and his career .284 wOBA and 77 wRC+ marks against left-handed pitching taking up prime lineup real estate. (Those are 53 points and 36 points worse than his performance against right-handed pitching, respectively.) Other times, it’s Kepler and another (or two) of the younger left-handed hitters, like Alex Kirilloff, Matt Wallner, Edouard Julien, or Trevor Larnach. They all theoretically could benefit long-term from reps against southpaws, but have demonstrated little to suggest they can hold their own against them in the present: Sometimes last season, it was even Joey Gallo and his greater than 40% career whiff rate against left-handed pitching. In prior seasons, it had been Jake Cave, Nick Gordon, and Luis Arráez. No matter the configuration, the results haven’t been very good. Over the past three seasons, the Twins rank 20th in overall team production (.312 wOBA) against left-handed pitching, and 17th (.323) against left-handed starting pitching. In a vacuum, including some left-handed hitters against left-handed pitching puts the Twins at a disadvantage. At the league level, the data is clear that there is a disadvantage for hitters when they are facing same-handed pitching. Since 2008, left-handed batters have performed 28 points of wOBA worse against left-handed pitching than they have against righties. But daily lineup decisions aren’t made in a vacuum. Many different variables and considerations come into play. Kepler’s valuable defense in right field is one. The injury and availability status and current composition of the rest of the roster is another. The long-term development needs of young players might be another, among many others. As ideal as it might appear to be in theory, rarely is it possible to stack the lineup with only right-handed hitters against left-handed pitching (or vice versa with left-handed hitters against right-handed pitching).
- 14 comments
-
- 8
-
-

-
- edouard julien
- max kepler
- (and 1 more)
-
Pitch Framing and Twins Pitchers
John Foley commented on John Foley's blog entry in Baseball Intelligence
Thank you! If you haven't seen it yet, Parker also wrote a great piece a few days ago that includes quotes from Castro about his approach and mindset to framing: http://twinsdaily.com/_/minnesota-twins-news/minnesota-twins/did-you-know-that-jason-castro-is-good-at-framing-r5420 I hadn't read it when I posted, but it's obviously very well related.- 7 comments
-
- 1
-
-
- jason castro
- pitch framing
- (and 3 more)
-
On Wednesday, November 30, 2016 the Twins announced the signing of free agent catcher Jason Castro to a 3-year, $24.5MM contract. It was a move that was widely attributed to the members of the Twins’ new front office comfort with advanced analytics. Jason Castro is widely regarded as very good defensive catcher due in large part to his ability to frame pitches and steal strikes for his pitchers. In 2016 Castro ranked third in all of baseball in Baseball Prospectus’ Framing Runs statistic, with +16.3. Kurt Suzuki, the Twins primary catcher in 2016, ranked 92nd at -6.8. Suzuki’s main backup, Juan Centeno, ranked 97th with -9.7. Castro is a roughly average offensive catcher. He put together a 88 wRC+ in 2016, which ranked 17th among catchers with at least 250 PAs, via Fangraphs. For reference, the league average wRC+ for catchers in 2016 was 87. But, he got a $24.5MM contract primarily because of his framing and the Twins are expecting him to make an impact on their pitching staff. So where might the Twins pitchers benefit from better framing? Let’s look at the Twins pitchers (that are still with the organization in 2017) that threw at least 50 innings in 2016, sorted by innings pitched: Using this list of pitchers, we can utilize Fangraphs' excellent heatmaps tool to explore each pitcher’s distribution of pitches around the strike zone. For example, here is Kyle Gibson’s 2016 pitch% heatmap, which displays the percentage of pitches thrown to each particular segment in and around the strike zone (shown from the pitcher’s perspective). The rulebook defined strike zone is outlined in black. There are not many surprises here, as we can see Gibson most often pitches down in the zone, and to his arm side. This is likely driven in large part to the high number of 2-seam sinking fastballs he throws (27.2% of total pitches in 2016, per PITCHf/x data available on Fangraphs). What this data also lets us do, is explore each pitcher’s propensity for pitching to the edges of the strike zone. Let’s assume much of the benefit of pitch framing occurs at the edges of the strike zone, where pitches are less definitively a ball or a strike to the eyes of the umpire. By focusing on the edges of the zone we can identify which Twins pitchers might benefit most from better framing. For this analysis, I focused explicitly on the strike zone segments just inside and just outside the rulebook strike zone, which are the areas between the gold lines in the graphic below: Using the pitch data in these sections, I calculated a metric for each Twins pitcher labeled "Total Edge%". These data points are summarized in the table below and show us the percentage of pitches thrown on the edge, or just off the edge of the strike zone, by each Twins pitcher in 2016: What we can see is the Twins starting pitchers seemed to pitch toward the edges of the strike zone more than the league average and more than their reliever teammates in 2016, with the exception of Brandon Kintzler. Ervin Santana is approximately at league average, which was 44.7%. Kyle Gibson is significantly above, at almost 49%. Jose Berrios, Phil Hughes, and Hector Santiago are all up around 47%. So, as a starting point, we can assert that Gibson, Berrios, Hughes, and Santiago are the primary candidates to benefit from better framing. But how do they fare in getting called strikes around the edges of the zone? Using the same heatmaps tool, we are also able to visualize each pitcher’s called strike percentage (cStrike%), in each segment of the strike zone. Here is Gibson’s for 2016: As we would expect, pitches located in the middle of the zone are nearly always called a strike, evidenced by the bright red boxes and rates at or near 100%. As before, our interest is just on and just off the edge of the strike zone, which I again outline in gold. Here, we see more variation, with the called strike percentage ranging from as high as 88% in the zone to Gibson’s arm side, to as low as 27% inside the zone up and to his glove side. We also see, pitches just off the strike zone are called strikes at a much lower percentage than pitches just in the zone, as you would expect. But, we need a reference point. How do the Twins compare against the rest of baseball? Using this data, I calculated two additional metrics, labelled as "In-Zone Edge cStrike%" and "Out-Zone Edge cStrike%", which delineate the called strike percentage on the edge and in the zone, and on the edge and out of the zone. Focusing on these strike zone segments, I calculated the called strike percentage for each Twins pitcher. Also included are the MLB averages for each metric. What we see above, is that 6 of the 10 Twins pitchers to throw 50 innings last season had a lower than league average called strike rate on pitches on the edge and inside the legal strike zone. Ryan Pressly and Jose Berrios appear to be the most impacted, with called strike rates significantly less than the league average of 64.9%, at 52.8% and 57.5% respectively. But what about just off the edge? When we focus on the segments just off the strike zone we see this same trend play out, but even more significantly. The visual above shows that 8 of the 10 Twins hurlers had lower than league average called strike rates on pitches just off the strike zone. This indicates that they were not getting many strikes stolen in their favor. In most cases for the Twins, the difference from league average is quite significant. Berrios, Michael Tonkin, Pressly, Taylor Rogers, and Santiago each have rates right around half the league average of 10.4%. The net result, when we add up the In-Zone and Out-Zone Edge cStrike% for Total Edge cStrike%, is that 7 of the 10 Twins pitchers studied had called strikes rates around the edges of the strike zone that were decidedly less than league average. Now, this probably isn’t all that surprising intuitively. We know the Twins as a whole did not pitch well last year (29th in ERA, 27th in FIP, per Fangraphs), and we know the Twins catchers did not rate well as pitch framers. Kurt Suzuki and Juan Centeno combined to catch nearly 86% of the Twins defensive innings last season. But for as bad as the team pitched, it is also clear the pitchers were not getting much help from their catchers. But how many pitches are we talking about here? If we assume a league average called strike rate on the edges of the strike zone (which was 36.1% in 2016) for the Twins, we can estimate an additional number of pitches that would be called strikes. This is what we find: By this analysis, it seems that Jose Berrios, Ryan Pressly, and Ervin Santana would benefit the most from better pitch framing, with each gaining roughly 20 additional called strikes over the course of the season. But how much does a pitch being called a ball, instead of a strike, actually matter? Let’s look at the major league batting average by count in a plate appearance. The data in the table below is from a 2014 Grantland article written by Joe Lemire, and calculates the batting average for plate appearances ending on specific counts. For example, the batting average on plate appearances ending on the 0-1 pitch is .321. The data fluctuates slightly year to year, but in any given season, you’ll find a table that generally looks like this: By this measure, the value of a strike, depending on the count is quite significant. In a 1-1 count, for example, if the next pitch is called a strike, making the count 1-2, the batter’s expected batting average drops from .319 to .164. Similarly, if the pitch is a ball, making the count 2-1, the batter’s expected average increases to .327. That’s a .163 swing in expected batting average. Others have approached this differently by trying to calculate the expected outcomes by the result of the at bat that reaches each count. So, for example, what is the expected outcome for all plate appearances that reached an 0-1 count, regardless of whether it was the 0-1 pitch that the outcome of the plate appearance was created? Different approaches aside, we find a similar result according to a revisit of the idea by Matt Hartzell published on RO Baseball in 2016: While the differences here are not quite as steep as before, we still see the swings matter. Batting average after a 1-2 count is .178, where after a 2-1 count it is .247. That’s still a .069 swing in batting average. We also have added on-base percentage, and see the trend holds. OBP after a 2-1 count in 2016 was .383, versus just .229 after a 1-2 count. So, all of this helps us show the Twins have a pitch framing problem and pitch framing matters because getting more pitches called strikes leads to less runners on base. But can Jason Castro fix it? To try to find out, let’s look at the Houston Astros, Castro’s former employer. Using the same methodology as with the Twins pitchers, I again calculated the cStrike% on the edges of the strike zone for the all Astros pitchers that threw more than 50 IP in 2016. What we find is pretty telling: Of the 12 Astros to throw more than 50 IP, only one, Michael Feliz, had a lower than league average called strike rate around the edge of the strike zone. But even he was roughly league average (36.06% compared to league average of 36.11%). The rest of the pitchers studied were above league average, and in most cases, quite comfortably so. Six of them are clustered close together right around 41.0%. Now, to be fair, not all of this is directly attributable to Castro. These are different, and arguably, better pitchers. And Castro didn’t catch every pitch thrown (he caught 61.9% of the Astros defensive innings in 2016). But the difference is stark and by this rough measure, it seems Jason Castro will make a positive impact for the Twins pitchers. To the Twins credit, they recognized they had a weakness, and they used the free agent market to acquire a player they hope can help address it.
- 7 comments
-
- 5
-
-
- jason castro
- pitch framing
- (and 3 more)
-
Pitch Framing and Twins Pitchers
Images added to a gallery album owned by John Foley in Members Albums Category
Tables, Graphs, and Pictures for Pitch Framing and Twins Pitchers blog post. -
-

From the album: Pitch Framing and Twins Pitchers
-

From the album: Pitch Framing and Twins Pitchers
-

From the album: Pitch Framing and Twins Pitchers
-

From the album: Pitch Framing and Twins Pitchers

.png.e5c498e7d2eabdcd708717f9ef165d8a.png)


.png.c3544b02621fa7db4c3e041764b51391.png)

.png.f275120a6304d4042e6f591aa31c0870.png)
.png.d1898abfeb2e4642f55011a8c5de2e3e.png)

.png.8db71c1fbfd45d93202be6f2f1153bfe.png)


