



jharaldson
-
Posts
403 -
Joined
-
Last visited
Content Type
Profiles
Minnesota Twins News, Rumors & Analysis
Minnesota Twins Videos
2026 Minnesota Twins Top Prospect Rankings
2022 Minnesota Twins Draft Picks & Signing Bonuses
Minnesota Twins Trade & Free Agent Rumors
Minnesota Twins Fan Guides & Resources
2023 Minnesota Twins Draft Picks & Signing Bonuses
The Minnesota Twins Players Project
2024 Minnesota Twins Draft Picks & Signing Bonuses
2025 Minnesota Twins Draft Picks & Signing Bonuses
2026 Minnesota Twins Draft Picks & Signing Bonuses
Forums
Blogs
Events
Store
Downloads
Gallery
Everything posted by jharaldson
-
College/International Player Draft Payroll Reduction
jharaldson replied to jharaldson's topic in Twins Minor League Talk
I sourced the international number from Baseball America and provided linked documentation to it. Do you believe that Baseball America has reported the international draft slots inaccurately or do you have a source that shows an alternate number? -
College/International Player Draft Payroll Reduction
jharaldson replied to jharaldson's topic in Twins Minor League Talk
Agreed, the Twins had 13 picks in the 2012 draft and only 10 in the 2013 draft which accounts for that reduction in spending. The question is should the Twins sit on that money or should they put that money to use and try to sign some of the available Cuban prospects that don't count against the caps? I would say that this team would be better if we used that money to sign some of these over 23 year old prospects from Cuba that don't count against the international spending caps. -
I recently read a story about how the Twins balked at signing a Cuban pitcher (Dalier Hinojosa) for a $4 million bonus even though it would not count against the hard caps for International player signing and it got me thinking about how much the Twins are investing in these areas compared to 2012. College Draft 2012 - $12.4 million Breaking Down Bonus Money for the 2012 MLB Draft International Draft 2012 - $2.9 million International Bonus Slots Another Sign Of Draft Nearing - BaseballAmerica.com All Prospects 2012 - $15.3 million College Draft 2013 - $8.2 million Draft Bonus Pools Rise 8.2 Percent - BaseballAmerica.com International Draft 2013 - $3.2 million International Bonus Slots Another Sign Of Draft Nearing - BaseballAmerica.com All Prospects 2013 - 11.4 million Total Decrease in Prospect Payroll = $3.9 million or %25
-
Teams that follow your lessons tend to have low payrolls because of a reliance on players in team control and trades of veterans for prospects. Here is a chart showing playoff performance over the past 5 years. [TABLE=width: 308] Year Team Playoffs Champion [TD=align: right]2011[/TD] Rays[TD=align: right]42[/TD] [/TD] [TD=align: right]2008 Rays[TD=align: right]43[/TD] [/TD] [TD=align: right]2011 Diamondbacks[TD=align: right]53[/TD] [/TD] [TD=align: right]2012 A's[TD=align: right]55[/TD] [/TD] [TD=align: right]2010 Rangers[TD=align: right]55[/TD] [/TD] [TD=align: right]2009 Twins[TD=align: right]65[/TD] [/TD] [TD=align: right]2010 Rays[TD=align: right]72[/TD] [/TD] [TD=align: right]2010 Reds[TD=align: right]72[/TD] [/TD] [TD=align: right]2009 Rockies[TD=align: right]75[/TD] [/TD] [TD=align: right]2012 Orioles[TD=align: right]81[/TD] [/TD] [TD=align: right]2012 Nationals[TD=align: right]81[/TD] [/TD] [TD=align: right]2008 Brewers[TD=align: right]81[/TD] [/TD] [TD=align: right]2012 Reds[TD=align: right]82[/TD] [/TD] [TD=align: right]2010 Braves[TD=align: right]84[/TD] [/TD] [TD=align: right]2011 Brewers[TD=align: right]86[/TD] [/TD] [TD=align: right]2009 Cardinals[TD=align: right]88[/TD] [/TD] [TD=align: right]2011 Rangers[TD=align: right]92[/TD] [/TD] [TD=align: right]2010 Twins[TD=align: right]98[/TD] [/TD] [TD=align: right]2010 Giants [/TD][TD=align: right]98 [TD=align: right]2008[/TD] Phillies [/TD][TD=align: right]98 [TD=align: right]2009[/TD] Dodgers[TD=align: right]100[/TD] [/TD] [TD=align: right]2011 Cardinals [/TD][TD=align: right]105 [TD=align: right]2011[/TD] Tigers[TD=align: right]106[/TD] [/TD] [TD=align: right]2012 Cardinals[TD=align: right]110[/TD] [/TD] [TD=align: right]2009 Phillies[TD=align: right]113[/TD] [/TD] [TD=align: right]2009 Angels[TD=align: right]114[/TD] [/TD] [TD=align: right]2012 Giants [/TD][TD=align: right]118 [TD=align: right]2008[/TD] Cubs[TD=align: right]118[/TD] [/TD] [TD=align: right]2008 Dodgers[TD=align: right]118[/TD] [/TD] [TD=align: right]2008 Angels[TD=align: right]119[/TD] [/TD] [TD=align: right]2008 White Sox[TD=align: right]121[/TD] [/TD] [TD=align: right]2009 Red Sox[TD=align: right]123[/TD] [/TD] [TD=align: right]2012 Tigers[TD=align: right]132[/TD] [/TD] [TD=align: right]2008 Red Sox[TD=align: right]133[/TD] [/TD] [TD=align: right]2010 Phillies[TD=align: right]142[/TD] [/TD] [TD=align: right]2011 Phillies[TD=align: right]173[/TD] [/TD] [TD=align: right]2012 Yankees[TD=align: right]198[/TD] [/TD] [TD=align: right]2009 Yankees [/TD][TD=align: right]201 [TD=align: right]2011[/TD] Yankees[TD=align: right]202[/TD] [/TD] [TD=align: right]2010 Yankees[TD=align: right]206[/TD] [/TD] [TD=align: right]103.8 [TD=align: right]124[/TD] [/TABLE] A couple of things I note: 1. No team with a payroll under $95 million has won the World Series. 2. Only 1 team with a payroll over $120 million has won the World Series. My conclusion is that the best teams don't rely on just one way to build a team (Farm vs. Free Agent) but they do both.
-
Article: Twins Season Takes Another Dismal Turn
jharaldson replied to Nick Nelson's topic in Twins Daily Front Page News
Regardless of if you agree with the strategy Terry Ryan took this season or not I think Nick's point of the youth movement being dismal in 2013 is spot on. If you take projections for the team like those provided by Phil Mackey: Mackey: Projecting the Minnesota Twins' 2013 regular season record | 1500 ESPN Twin Cities ? Minnesota Sports News & Opinion (Twins, Vikings, Wolves, Wild, Gophers) | Sportswire: Minnesota Twins And compare them to actuals for the young guys we wanted to take steps forward it is pretty depressing: [TABLE=width: 441] Proj OBP Proj SLG Proj OPS Real OPS Dif Aaron Hicks 0.315 0.388 0.703 0.597 -0.106 Chris Parmelee 0.335 0.425 0.760 0.675 -0.085 Trevor Plouffe 0.306 0.444 0.750 0.702 -0.048 Brian Dozier 0.306 0.367 0.673 0.688 0.015 Pedro Florimon 0.293 0.336 0.629 0.639 0.010 [/TD] Pitcher Proj ERA Real ERA Dif Vance Worley 4.00 7.21 3.21 Scott Diamond 4.15 5.52 1.37 Kyle Gibson 4.07 6.21 2.14 Samuel Deduno 4.79 3.18 -1.61 [TD] [/TABLE] Of these 9 guys that were supposed to be a supporting cast to what would be a Mauer/Sano/Buxton/Meyer core there is one bright spot (Deduno) 2 guys that have been fine (Dozier/Florimon) and a bunch of failure. -
remove, attachments are not showing correctly.


-
Dave St. Peter said something on Talking Twins on AM1500 that bugged me about this: Inside Twins with Phil Mackey - Audio - 1500 ESPN - Twin Citie How did he pitch in 25 games last year with 129 innings and not have that come up last year with the Nationals but with half of that workload he is suddenly on the shelf for 2 months?
-
Gleeman: Buxton/Sano vs. past top prospect duos
jharaldson replied to Nick Nelson's topic in Twins Minor League Talk
Sano has an OPS of .827 in his time at AA which would rank 13th in AA if he had enough qualifying AB's. Struggling for Sano looks pretty good. -
Trevor May is currently 65th in era in AA and has not thrown a quality start in his last 3 outings. This is his second go at AA and he is muddling along in the middle of the pack. Alex Meyer was doing much better in AA but has not pitched in over a month and has no timetable to return from injury. Terry deserves an incomplete on those moves but I would feel a lot better if one of those guys was developing a Buxton/Sano like buzz.
-
A couple of reasons to be against this: 1. Improvement - Vance Worley had a 7.22 ERA in April and 7.20 in May showing no improvement. Pelfrey had a 7.66 ERA in April but dropped it 2 runs to 5.50 in May. 2. Injury - Worley had a minor corrective procedure to remove bone spurs last September which we haven't heard caused him any issue this year. Pelfrey is coming off of Tommy John and was expected to start the season weaker and get better. I don't think his leash is super long but Pelfrey probably deserves another 4-5 starts before pulling the plug.
-
Joe had 411 runners on last year while the guy who had Joe Mauer in front of him (Willingham) had 459 runners. If you apply Mauers RBI% to Willinghams total (%18.25) you get a total of 84 RBI. When you add in his 10 HR from last year you get a total of 94 RBI which would rank him tied for 25 in the MLB last year. RBI Percentage 2012 Regular Season MLB Baseball Batting Statistics and League Leaders - Major League Baseball - ESPN
-
Mackey states in this article "Ryan said the Twins will likely limit Gibson's innings to somewhere between 130 and 140 in 2013". Mackey: How does a 'healthy' Kyle Gibson fit into Twins' 2013 plans? | 1500 ESPN Twin Cities ? Minnesota Sports News & Opinion (Twins, Vikings, Wolves, Wild, Gophers) | Sportswire: Minnesota Twins
-
Article: Free Agent Pitching: 20/20 Hindsight
jharaldson replied to Steven Buhr's topic in Twins Daily Front Page News
Correlation is measured between -1 and 1. Anything above 0 is considered correlation and I generally think of it this way: .66-1 = High correlation .33-.66 = Moderate Correlation 0-.33 = Low correlation So contract size is moderate to low correlation but still well above a crap shoot which I interpreted as no correlation. -
Article: Free Agent Pitching: 20/20 Hindsight
jharaldson replied to Steven Buhr's topic in Twins Daily Front Page News
I thought I would do some math to prove or disprove this point. To start with, I took the top 25 contracts from the ESPN Free Agent Tracker and ordered them from largest to smallest: 2012 MLB Baseball Free Agent Tracker - Major League Baseball - ESPN I then went to FanGraphs and created a custom report for these players and ranked them by ERA: Major League Leaderboards » 2013 » Pitchers » Custom Statistics | FanGraphs Baseball I put both of these together in a spreadsheet: [TABLE=width: 303] ContractRank ERARank Name ERA 1 1 Zack Greinke 1.62 25 2 Francisco Liriano 1.69 10 3 Hisashi Iwakuma 1.84 2 4 Anibal Sanchez 2.05 9 5 Hiroki Kuroda 2.31 15 6 Scott Feldman 2.53 6 7 Jeremy Guthrie 2.82 13 8 Kevin Correia 3.35 4 9 Hyun-Jin Ryu 3.4 20 10 Jason Marquis 3.49 5 11 Ryan Dempster 3.75 12 12 Andy Pettitte 3.83 18 13 Roberto Hernandez 4.43 19 14 Bartolo Colon 4.56 11 15 Dan Haren 4.76 7 16 Brandon McCarthy 5.63 23 17 Jeff Francis 6 3 18 Edwin Jackson 6.02 22 19 John Lannan 6.14 8 20 Joe Blanton 6.46 17 21 Mike Pelfrey 6.57 14 22 Brett Myers 8.02 16 23 Scott Baker [/TD] 20 24 Jeff Karstens 24 25 Jair Jurrjens[TD] [/TABLE] One interesting thing is 7 of the top 11 guys in ERA are from the top 11 contracts signed in the offseason. When I ran the correlation numbers it came up as a .39 correlation which is not high but shows there is a correlation between contract size and performance. In short, free agent pitchers are not a crap shoot. There is a moderate correlation between the amount you spend and the performance you get.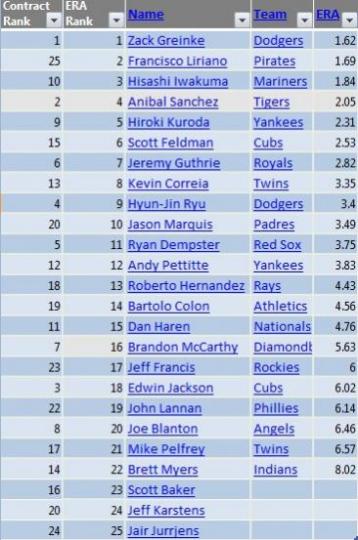
-
Article: The Bullpen is Booming
jharaldson replied to Nick Nelson's topic in Twins Daily Front Page News
I have concerns that Swarzak is unable to horseplay at a major league level. -
Team Draft Spend (Internation & Domestic)
jharaldson replied to jharaldson's topic in Minnesota Twins Talk
Who else did they sign? I only found Thorpe for $500,000 and Minier for $1,400,000? -
I asked a question to Phil Mackey on a recent Twins chat: Read the transcript from Phil Mackey's live Twins chat | 1500 ESPN Twin Cities ? Minnesota Sports News & Opinion (Twins, Vikings, Wolves, Wild, Gophers) | Sportswire: Minnesota Twins [TABLE=width: 100%] [TD=class: chatmsgtime]1:56 [/TD] [TD=class: chatmsgtext viewer_text][TABLE] [/TD] [Comment From GuestGuest: ] In 2007 when the Twins cut payroll to retool their club ($71 Million -> $57 million) they spent some of the difference on pre-paying guys via signing bonuses (Morneau $6 million, Cuddyer $3 million). How are the 2013 Twins putting their available payroll ($100 million -> $80 million) to work in 2013 based on your reporting? [/TABLE] Tuesday March 5, 2013 1:56 Guest [/TABLE] [TABLE=width: 100%] [TD=class: chatmsgtime]1:56 [/TD] [TD=class: chatmsgtext altcaster_text][TABLE] http://cdnmo.coveritlive.com/media/avitars/phpwjkHkuPMac1500armscrossed.jpg The Twins spent more money in the draft and international signings last year than any team in baseball (something like $18 million) [/TABLE] [/TD] [/TABLE] For some reason the $18 million number looked off to me so I went out to research it and found the following: Domestic Draft BaseballAmerica.com: Draft: Early Draft Preview: Draft 2012: What Your Team Has To Spend International Draft 2012 MLB International Free Agent Tracker » 85% Sports Adding these together creates the following chart: [TABLE=width: 747] Team International Spend Draft Spend Total Minnesota Twins $1,900,000.00 $12,368,200.00 $14,268,200.00 San Diego Padres $2,090,000.00 $9,903,100.00 $11,993,100.00 Houston Astros $300,000.00 $11,177,700.00 $11,477,700.00 Toronto Blue Jays $2,175,000.00 $8,830,800.00 $11,005,800.00 St. Louis Cardinals $1,400,000.00 $9,131,100.00 $10,531,100.00 Chicago Cubs $2,200,000.00 $7,933,900.00 $10,133,900.00 Oakland Athletics $750,000.00 $8,469,500.00 $9,219,500.00 New York Mets $1,885,000.00 $7,151,400.00 $9,036,400.00 Pittsburgh Pirates $1,700,000.00 $6,563,500.00 $8,263,500.00 Boston Red Sox $1,360,000.00 $6,884,800.00 $8,244,800.00 Seattle Mariners $0.00 $8,223,400.00 $8,223,400.00 Cleveland Indians $2,575,000.00 $4,582,900.00 $7,157,900.00 Milwaukee Brewers $370,000.00 $6,764,700.00 $7,134,700.00 New York Yankees $2,900,000.00 $4,192,200.00 $7,092,200.00 Kansas City Royals $955,000.00 $6,101,500.00 $7,056,500.00 Baltimore Orioles $0.00 $6,826,900.00 $6,826,900.00 Colorado Rockies $50,000.00 $6,628,300.00 $6,678,300.00 Cincinnati Reds $0.00 $6,653,800.00 $6,653,800.00 Texas Rangers $0.00 $6,568,200.00 $6,568,200.00 Tampa Bay Rays $2,550,000.00 $3,871,000.00 $6,421,000.00 Chicago White Sox $450,000.00 $5,915,100.00 $6,365,100.00 Philadelphia Phillies $1,115,000.00 $4,916,900.00 $6,031,900.00 San Francisco Giants $1,775,000.00 $4,076,400.00 $5,851,400.00 Los Angeles Dodgers $0.00 $5,202,800.00 $5,202,800.00 Miami Marlins $125,000.00 $4,935,100.00 $5,060,100.00 Washington Nationals $0.00 $4,436,200.00 $4,436,200.00 Atlanta Braves $300,000.00 $4,030,800.00 $4,330,800.00 Arizona Diamondbacks $0.00 $3,818,300.00 $3,818,300.00 Detroit Tigers $0.00 $2,099,300.00 $2,099,300.00 Los Angeles Angels $0.00 $1,645,700.00 $1,645,700.00 [/TD] $28,925,000.00 $189,903,500.00 $218,828,500.00 Average [TD=align: right]$7,294,283.33 [/TABLE] The interesting things I found were: - P-Mac was only off by $4 million, which is closer then I thought. - The Twins are spending $7 million more than the average team - If you add the additional draft spend to the Twins payroll ($80 million + $7 Draft over Average) you are still $13 million under a projected $100 million payroll. - The Angels are really stealing from the draft to pay their free agents.
-
Mackey: Trevor May Drawing Highest Praise of Young Pitchers
jharaldson replied to John Bonnes's topic in Minnesota Twins Talk
Trevor May pitched 29 games last year in AA. In the first half he had a 4.97 ERA [TABLE=width: 383] Date Team Opp GS W L ERA IP ER [TD=align: right]6/25/2012[/TD] PHI (AA) @BAL[TD=align: right]1[/TD] [TD=align: right]0[/TD] [TD=align: right]1[/TD] [TD=align: right]5.4[/TD] [TD=align: right]5[/TD] [TD=align: right]3[/TD] [TD=align: right]6/20/2012[/TD] PHI (AA) @TOR[TD=align: right]1[/TD] [TD=align: right]0[/TD] [TD=align: right]1[/TD] [TD=align: right]7.2[/TD] [TD=align: right]5[/TD] [TD=align: right]4[/TD] [TD=align: right]6/15/2012[/TD] PHI (AA) CLE[TD=align: right]1[/TD] [TD=align: right]1[/TD] [TD=align: right]0[/TD] [TD=align: right]3[/TD] [TD=align: right]6[/TD] [TD=align: right]2[/TD] [TD=align: right]6/8/2012[/TD] PHI (AA) WSN[TD=align: right]1[/TD] [TD=align: right]0[/TD] [TD=align: right]1[/TD] [TD=align: right]5.06[/TD] [TD=align: right]5.33[/TD] [TD=align: right]3[/TD] [TD=align: right]6/3/2012[/TD] PHI (AA) @BAL[TD=align: right]1[/TD] [TD=align: right]0[/TD] [TD=align: right]1[/TD] [TD=align: right]14.73[/TD] [TD=align: right]3.67[/TD] [TD=align: right]6[/TD] [TD=align: right]5/27/2012[/TD] PHI (AA) @WSN[TD=align: right]1[/TD] [TD=align: right]0[/TD] [TD=align: right]0[/TD] [TD=align: right]5.68[/TD] [TD=align: right]6.33[/TD] [TD=align: right]4[/TD] [TD=align: right]5/22/2012[/TD] PHI (AA) @DET[TD=align: right]1[/TD] [TD=align: right]0[/TD] [TD=align: right]0[/TD] [TD=align: right]31.5[/TD] [TD=align: right]2[/TD] [TD=align: right]7[/TD] [TD=align: right]5/16/2012[/TD] PHI (AA) BOS[TD=align: right]1[/TD] [TD=align: right]0[/TD] [TD=align: right]0[/TD] [TD=align: right]3.6[/TD] [TD=align: right]5[/TD] [TD=align: right]2[/TD] [TD=align: right]5/11/2012[/TD] PHI (AA) @MIN[TD=align: right]1[/TD] [TD=align: right]0[/TD] [TD=align: right]1[/TD] [TD=align: right]1.42[/TD] [TD=align: right]6.33[/TD] [TD=align: right]1[/TD] [TD=align: right]5/5/2012[/TD] PHI (AA) DET[TD=align: right]1[/TD] [TD=align: right]0[/TD] [TD=align: right]1[/TD] [TD=align: right]7.2[/TD] [TD=align: right]5[/TD] [TD=align: right]4[/TD] [TD=align: right]4/30/2012[/TD] PHI (AA) @TOR[TD=align: right]1[/TD] [TD=align: right]0[/TD] [TD=align: right]0[/TD] [TD=align: right]2.57[/TD] [TD=align: right]7[/TD] [TD=align: right]2[/TD] [TD=align: right]4/25/2012[/TD] PHI (AA) SFG[TD=align: right]1[/TD] [TD=align: right]1[/TD] [TD=align: right]0[/TD] [TD=align: right]0[/TD] [TD=align: right]6[/TD] [TD=align: right]0[/TD] [TD=align: right]4/17/2012[/TD] PHI (AA) @SFG[TD=align: right]1[/TD] [TD=align: right]1[/TD] [TD=align: right]0[/TD] [TD=align: right]1.8[/TD] [TD=align: right]5[/TD] [TD=align: right]1[/TD] [TD=align: right]4/12/2012[/TD] PHI (AA) @WSN[TD=align: right]1[/TD] [TD=align: right]1[/TD] [TD=align: right]0[/TD] [TD=align: right]1.29[/TD] [TD=align: right]7[/TD] [TD=align: right]1[/TD] [TD=align: right]4/6/2012[/TD] PHI (AA) BOS[TD=align: right]1[/TD] [TD=align: right]1[/TD] [TD=align: right]0[/TD] [TD=align: right]7.2[/TD] [TD=align: right]5[/TD] [TD=align: right]4[/TD] [/TD] [TD=align: right]4.97 [TD=align: right]79.66[/TD] [TD=align: right]44[/TD] [/TABLE] In the second half he had a 4.59 ERA. [TABLE=width: 383] Date Team Opp GS W L ERA IP ER [TD=align: right]9/6/2012[/TD] PHI (AA) NYY[TD=align: right]1[/TD] [TD=align: right]0[/TD] [TD=align: right]0[/TD] [TD=align: right]1.69[/TD] [TD=align: right]5.33[/TD] [TD=align: right]1[/TD] [TD=align: right]9/1/2012[/TD] PHI (AA) @BOS[TD=align: right]1[/TD] [TD=align: right]0[/TD] [TD=align: right]1[/TD] [TD=align: right]9[/TD] [TD=align: right]4[/TD] [TD=align: right]4[/TD] [TD=align: right]8/27/2012[/TD] PHI (AA) NYM[TD=align: right]1[/TD] [TD=align: right]1[/TD] [TD=align: right]0[/TD] [TD=align: right]1.13[/TD] [TD=align: right]8[/TD] [TD=align: right]1[/TD] [TD=align: right]8/22/2012[/TD] PHI (AA) @WSN[TD=align: right]1[/TD] [TD=align: right]0[/TD] [TD=align: right]1[/TD] [TD=align: right]1.29[/TD] [TD=align: right]7[/TD] [TD=align: right]1[/TD] [TD=align: right]8/17/2012[/TD] PHI (AA) @CLE[TD=align: right]1[/TD] [TD=align: right]0[/TD] [TD=align: right]1[/TD] [TD=align: right]20.25[/TD] [TD=align: right]2.67[/TD] [TD=align: right]6[/TD] [TD=align: right]8/12/2012[/TD] PHI (AA) @MIN[TD=align: right]1[/TD] [TD=align: right]1[/TD] [TD=align: right]0[/TD] [TD=align: right]3[/TD] [TD=align: right]6[/TD] [TD=align: right]2[/TD] [TD=align: right]8/7/2012[/TD] PHI (AA) @NYY[TD=align: right]1[/TD] [TD=align: right]0[/TD] [TD=align: right]1[/TD] [TD=align: right]3.6[/TD] [TD=align: right]5[/TD] [TD=align: right]2[/TD] [TD=align: right]8/2/2012[/TD] PHI (AA) @SFG[TD=align: right]1[/TD] [TD=align: right]0[/TD] [TD=align: right]1[/TD] [TD=align: right]2.57[/TD] [TD=align: right]7[/TD] [TD=align: right]2[/TD] [TD=align: right]7/28/2012[/TD] PHI (AA) MIN[TD=align: right]1[/TD] [TD=align: right]1[/TD] [TD=align: right]0[/TD] [TD=align: right]3.38[/TD] [TD=align: right]5.33[/TD] [TD=align: right]2[/TD] [TD=align: right]7/23/2012[/TD] PHI (AA) PIT[TD=align: right]1[/TD] [TD=align: right]0[/TD] [TD=align: right]1[/TD] [TD=align: right]7.2[/TD] [TD=align: right]5[/TD] [TD=align: right]4[/TD] [TD=align: right]7/18/2012[/TD] PHI (AA) @BOS[TD=align: right]1[/TD] [TD=align: right]0[/TD] [TD=align: right]1[/TD] [TD=align: right]10.8[/TD] [TD=align: right]5[/TD] [TD=align: right]6[/TD] [TD=align: right]7/13/2012[/TD] PHI (AA) BAL[TD=align: right]1[/TD] [TD=align: right]0[/TD] [TD=align: right]0[/TD] [TD=align: right]3.6[/TD] [TD=align: right]5[/TD] [TD=align: right]2[/TD] [TD=align: right]7/5/2012[/TD] PHI (AA) @PIT[TD=align: right]1[/TD] [TD=align: right]0[/TD] [TD=align: right]0[/TD] [TD=align: right]3.6[/TD] [TD=align: right]5[/TD] [TD=align: right]2[/TD] [TD=align: right]6/30/2012[/TD] PHI (AA) TOR[TD=align: right]1[/TD] [TD=align: right]1[/TD] [TD=align: right]0[/TD] [TD=align: right]5.4[/TD] [TD=align: right]5[/TD] [TD=align: right]3[/TD] [TD=align: right]6/25/2012[/TD] PHI (AA) @BAL[TD=align: right]1[/TD] [TD=align: right]0[/TD] [TD=align: right]1[/TD] [TD=align: right]5.4[/TD] [TD=align: right]5[/TD] [TD=align: right]3[/TD] [/TD] [TD=align: right]4.59 [TD=align: right]80.33[/TD] [TD=align: right]41[/TD] [/TABLE] I would not personally be that enthused by a 4.59 ERA. I understand that in the minors you frequently go off scouting reports and numbers don't tell the full story but my feeling is that as you progress through the minors the numbers do become more relevant and by AA/AAA they should begin reflecting what the scouts are saying. Another item of note, Trevor May ranked 69th among 84 pitchers in AA last year in ERA. Eastern (AA) Leaderboards » 2012 » Pitchers » Standard Statistics | FanGraphs Baseball His K/9 was very impressive at 4th among 84 pitchers: Eastern (AA) Leaderboards » 2012 » Pitchers » Advanced Statistics | FanGraphs Baseball But his FIP was awful AA at 77th among 84 pitchers: Eastern (AA) Leaderboards » 2012 » Pitchers » Advanced Statistics | FanGraphs Baseball Long story longer, I am not as optimistic as some on Trevor May and would prefer to see him repeat AA and see if he can improve on some of these numbers before we rush him to AAA/MLB this year. -
Dave St. Peter: We'll be competetive
jharaldson replied to John Bonnes's topic in Minnesota Twins Talk
Here are the Wild Card standings from August 15th last year [TABLE=width: 403] Wild Card Teams W L PCT WCGB Baltimore Orioles[TD=align: right]64[/TD] [TD=align: right]53[/TD] [TD=align: right]0.547[/TD] [TD=align: right]1[/TD] Tampa Bay Rays[TD=align: right]63[/TD] [TD=align: right]54[/TD] [TD=align: right]0.538[/TD] - Detroit Tigers[TD=align: right]63[/TD] [TD=align: right]55[/TD] [TD=align: right]0.534[/TD] [TD=align: right]0.5[/TD] Oakland Athletics[TD=align: right]61[/TD] [TD=align: right]55[/TD] [TD=align: right]0.526[/TD] [TD=align: right]1.5[/TD] Los Angeles Angels[TD=align: right]62[/TD] [TD=align: right]56[/TD] [TD=align: right]0.525[/TD] [TD=align: right]1.5[/TD] Boston Red Sox[TD=align: right]57[/TD] [TD=align: right]61[/TD] [TD=align: right]0.483[/TD] [TD=align: right]6.5[/TD] Toronto Blue Jays[TD=align: right]55[/TD] [TD=align: right]62[/TD] [TD=align: right]0.47[/TD] [TD=align: right]8[/TD] Seattle Mariners[TD=align: right]55[/TD] [TD=align: right]64[/TD] [TD=align: right]0.462[/TD] [TD=align: right]9[/TD] Cleveland Indians[TD=align: right]54[/TD] [TD=align: right]64[/TD] [TD=align: right]0.458[/TD] [TD=align: right]9.5[/TD] Kansas City Royals[TD=align: right]51[/TD] [TD=align: right]65[/TD] [TD=align: right]0.44[/TD] [TD=align: right]11.5[/TD] Minnesota Twins[TD=align: right]50[/TD] [TD=align: right]67[/TD] [TD=align: right]0.427[/TD] [TD=align: right]13[/TD] [/TABLE] I would consider the Twins as playing meaningful games if they are right around where the Red Sox and Blue Jays were which is only a 5-7 win improvement at that time, a little over 1 win per month. For St. Peter to state that he expects that his team is one the the 5-6 worst teams in the league instead of saying they are the worst team in the league is not that much of a stretch. -
Murphy: The low down on Scott Diamond's recovery
jharaldson replied to John Bonnes's topic in Minnesota Twins Talk
I am not a doctor but I googled bone chips and didn't find anything that showed that weight lifting would cause bone chips: Summit Medical Group - Bone Chips in the Elbow (Osteochondritis Dissecans) Most likely the weight lifting exposed the fact the Twins medical staff missed the chips on the exit physical. -
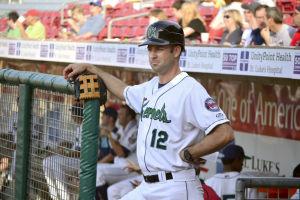
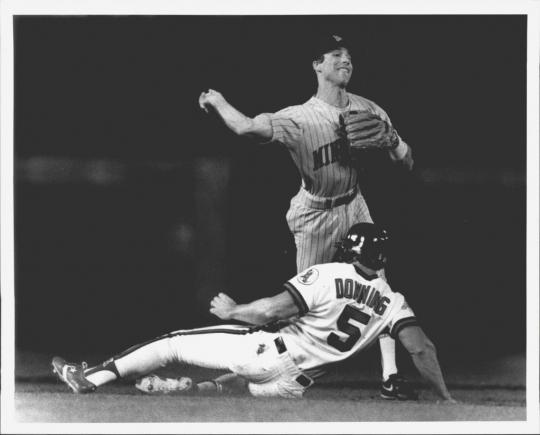
Gagne has that unique throwing motion where his elbow looks like it is at a right angle and that is the image that come to my mind:
-
I emailed Doogie about this topic and here is his response. I find it curious that he does not have firm reporting right now if this is an actual offer.
-
Chance Twins open season with 75/80m payroll??
jharaldson replied to greengoblinrulz's topic in Minnesota Twins Talk
Something else that supports a hard $80 million salary cap is that the Correia signing had $500,000 deferred into 2014 (2013-$4.5,2014-$5.5). Given we are $400,000 under $80 million this appears to have been done to stay under that number. -
Fun stat that I don't see that often, since Joe Mauer came in to the league in 2004 he is ranked 15th in the league in RBI % (% of runners on driven in). RBI % [TABLE=width: 427] Rank Player Runners On Runs Batted In Home Runs RBI Pct. 1 Aramis Ramirez 3384 872 251 18.35 2 Ryan Braun 2412 643 202 18.28 3 Miguel Cabrera 4133 1061 309 18.2 4 Ryan Howard 3415 920 300 18.16 5 Vladimir Guerrero 3213 794 215 18.02 6 Victor Martinez 3239 720 141 17.88 7 Magglio Ordonez 2570 570 116 17.67 8 Garret Anderson 2264 493 94 17.62 9 Albert Pujols 3931 1053 361 17.6 10 David Ortiz 3836 987 312 17.6 11 Bobby Abreu 3577 780 151 17.58 12 Manny Ramirez 2747 691 208 17.58 13 Michael Young 3776 801 143 17.43 14 Matt Holliday 3692 872 229 17.42 15 Joe Mauer 2839 587 94 17.37 [/TABLE]
-
Fangraphs.com publishes a dollar value which is a multiplier against their WAR. There is disagreement on this site if this is a valid indicator because it has shown guys with 5.00 ERA's to have significant value due to their secondary numbers remaining good but in my opinion it is the best I have seen published.


