Davy Andrews
-
Posts
28 -
Joined
-
Last visited
Content Type
Profiles
News
Minnesota Twins Videos
2026 Minnesota Twins Top Prospects Ranking
2022 Minnesota Twins Draft Picks
Minnesota Twins Free Agent & Trade Rumors, Notes, & Tidbits
Guides & Resources
2023 Minnesota Twins Draft Picks
The Minnesota Twins Players Project
2024 Minnesota Twins Draft Picks
2025 Minnesota Twins Draft Pick Tracker
2026 Minnesota Twins Draft Tracker: Picks & Bonuses
Forums
Blogs
Events
Store
Downloads
Gallery
Everything posted by Davy Andrews
-
It Was Too Short, but Carlos Correa’s 2024 Season Was Marvelous
Davy Andrews posted an article in Caretakers
.png.f34d3e34d28cfdc57c4e78769ef40c0b.png) What with the injury and the trade rumors and the gut-wrenching slow-motion trainwreck that was the final quarter of the Twins’ season, this article is here just to serve as a simple reminder: Carlos Correa had an absolutely bonkers 2024. According to FanGraphs, Correa put up 4.3 WAR in 2024 despite playing in just 83 games. That was the fourth-highest total of what has at least an outside chance of being a Hall of Fame career. This century, 153 shortstops have had seasons in which they put up at least 3.9 fWAR. Would you like to guess how many of them played fewer games than Correa? If you guessed zero, then you were right. In half a season, Correa was the 26th-most valuable position player in baseball. When he went down with plantar fasciitis on Jul. 12, his 3.6 fWAR ranked 10th among all position players. To be sure, having a great first half is never a guarantee that you’re going to have a great second half, but that’s still extraordinary. As much of a bummer as it is, staying healthy is a skill, and players who can do it deserve recognition. I’m not trying to say that Correa should be viewed as the best player in baseball this season, or even the best player on the Twins. What I am saying is that his absence made it too easy to ignore just how special this (half-)season was. Let’s not fall into that trap. Before we dig into just how Correa amassed all that WAR, I’ll just say quickly that this is why I’m not too worried about the trade speculation. Don’t get me wrong; I would be straight-up devastated if the Twins were to trade Correa. However, while it might be easy for Twins fans to miss this particular silver lining after a very cloudy season, I assure you that teams around baseball have not. They get just how valuable Correa is, especially considering his contract situation. He’s signed through the 2028 season, with another four years of club options at progressively smaller dollar amounts, which means that exercising them would reduce the contract’s average annual value against the competitive balance tax. You can bet that for Correa to accede to a deal, he would want at least one of those options exercised. Stop for a moment and try to imagine the prospect haul that would be required to acquire Correa on (say) an eight-year deal with a lower AAV than Nathan Eovaldi's. So while the Twins might listen to offers, it would take a monster offer for them to even consider it. Okay, let’s talk about how Correa did it.
What with the injury and the trade rumors and the gut-wrenching slow-motion trainwreck that was the final quarter of the Twins’ season, this article is here just to serve as a simple reminder: Carlos Correa had an absolutely bonkers 2024. According to FanGraphs, Correa put up 4.3 WAR in 2024 despite playing in just 83 games. That was the fourth-highest total of what has at least an outside chance of being a Hall of Fame career. This century, 153 shortstops have had seasons in which they put up at least 3.9 fWAR. Would you like to guess how many of them played fewer games than Correa? If you guessed zero, then you were right. In half a season, Correa was the 26th-most valuable position player in baseball. When he went down with plantar fasciitis on Jul. 12, his 3.6 fWAR ranked 10th among all position players. To be sure, having a great first half is never a guarantee that you’re going to have a great second half, but that’s still extraordinary. As much of a bummer as it is, staying healthy is a skill, and players who can do it deserve recognition. I’m not trying to say that Correa should be viewed as the best player in baseball this season, or even the best player on the Twins. What I am saying is that his absence made it too easy to ignore just how special this (half-)season was. Let’s not fall into that trap. Before we dig into just how Correa amassed all that WAR, I’ll just say quickly that this is why I’m not too worried about the trade speculation. Don’t get me wrong; I would be straight-up devastated if the Twins were to trade Correa. However, while it might be easy for Twins fans to miss this particular silver lining after a very cloudy season, I assure you that teams around baseball have not. They get just how valuable Correa is, especially considering his contract situation. He’s signed through the 2028 season, with another four years of club options at progressively smaller dollar amounts, which means that exercising them would reduce the contract’s average annual value against the competitive balance tax. You can bet that for Correa to accede to a deal, he would want at least one of those options exercised. Stop for a moment and try to imagine the prospect haul that would be required to acquire Correa on (say) an eight-year deal with a lower AAV than Nathan Eovaldi's. So while the Twins might listen to offers, it would take a monster offer for them to even consider it. Okay, let’s talk about how Correa did it. -
Carlos Correa only played 83 games, and the Twins only won 82. But don't let that distract you from what Correa just accomplished. Image courtesy of © Matt Blewett-Imagn Images What with the injury and the trade rumors and the gut-wrenching slow-motion trainwreck that was the final quarter of the Twins’ season, this article is here just to serve as a simple reminder: Carlos Correa had an absolutely bonkers 2024. According to FanGraphs, Correa put up 4.3 WAR in 2024 despite playing in just 83 games. That was the fourth-highest total of what has at least an outside chance of being a Hall of Fame career. This century, 153 shortstops have had seasons in which they put up at least 3.9 fWAR. Would you like to guess how many of them played fewer games than Correa? If you guessed zero, then you were right. In half a season, Correa was the 26th-most valuable position player in baseball. When he went down with plantar fasciitis on Jul. 12, his 3.6 fWAR ranked 10th among all position players. To be sure, having a great first half is never a guarantee that you’re going to have a great second half, but that’s still extraordinary. As much of a bummer as it is, staying healthy is a skill, and players who can do it deserve recognition. I’m not trying to say that Correa should be viewed as the best player in baseball this season, or even the best player on the Twins. What I am saying is that his absence made it too easy to ignore just how special this (half-)season was. Let’s not fall into that trap. Before we dig into just how Correa amassed all that WAR, I’ll just say quickly that this is why I’m not too worried about the trade speculation. Don’t get me wrong; I would be straight-up devastated if the Twins were to trade Correa. However, while it might be easy for Twins fans to miss this particular silver lining after a very cloudy season, I assure you that teams around baseball have not. They get just how valuable Correa is, especially considering his contract situation. He’s signed through the 2028 season, with another four years of club options at progressively smaller dollar amounts, which means that exercising them would reduce the contract’s average annual value against the competitive balance tax. You can bet that for Correa to accede to a deal, he would want at least one of those options exercised. Stop for a moment and try to imagine the prospect haul that would be required to acquire Correa on (say) an eight-year deal with a lower AAV than Nathan Eovaldi's. So while the Twins might listen to offers, it would take a monster offer for them to even consider it. Okay, let’s talk about how Correa did it. View full article
-
Meaningless Minnesota Twins Facts To Get You Through the Winter
Davy Andrews posted an article in Caretakers
.png.84e615bb39b51321a7c9913d37147887.png) Did you know that in 2024, Byron Buxton was the best ground-ball hitter in baseball? Of course you didn’t know that. Why would anyone know that? It’s information that offers no tangible benefit to anyone. It barely qualifies as trivia. But now you know it. In 2024, Buxton hit 75 ground balls, and on those ground balls, he batted .400 with an absurd 155 wRC+. The league as a whole batted .249, with a wRC+ of just 41. Buxton was more than three times better than the average player! To be clear, this means nothing at all. Buxton is a career .304 hitter on groundballs, with a wRC+ of 68. In 2024, he hit his grounders harder than usual, but not the hardest he’s ever hit them. It’s just a fun fact—one that you can use at holiday parties to signal to people that they shouldn’t waste any more time talking to you. Having the ability to successfully chat people up is a useful gift, but even more useful is the ability to say something so specifically meaningless that they’ll leave you alone. That’s our goal for the day. We’re ice fishing for fun, useless stats. Here's our second stupid fact of the day. Stathead has a split finder feature, in which it separates pitchers into groundball pitchers or fly ball pitchers. Against fly ball pitchers, the Twins were the best team in baseball. Their .782 OPS was the highest in the league, and their 114 home runs trailed only the Yankees. That part makes sense. The Twins have cultivated a team full of hitters who try to pull the ball in the air. They’re going to fare well against pitchers who throw four-seamers up in the zone. If we look in the other direction, you won’t be surprised to learn that against groundball pitchers, the Twins ranked all the way down at 25th, with a .667 OPS. In fact, if you look at the past five seasons, the Twins still rank all the way down at 25th. That’s one of the dangers of cultivating a team with a singular focus, rather than a diversity of approaches and swing paths. Everyone will have the same weakness. Wait, we’re coming dangerously close to pulling a lesson from our statistics, and that’s not what we’re going for at all. Let’s get back to nonsense: You know how the Twins were the best team in baseball against fly ball pitchers? Well they also grounded into the most double plays against fly ball pitchers. They grounded into 60 double plays against fly ball pitchers. How is that even possible? Against groundball pitchers, they ranked all the way down at 21st!
Did you know that in 2024, Byron Buxton was the best ground-ball hitter in baseball? Of course you didn’t know that. Why would anyone know that? It’s information that offers no tangible benefit to anyone. It barely qualifies as trivia. But now you know it. In 2024, Buxton hit 75 ground balls, and on those ground balls, he batted .400 with an absurd 155 wRC+. The league as a whole batted .249, with a wRC+ of just 41. Buxton was more than three times better than the average player! To be clear, this means nothing at all. Buxton is a career .304 hitter on groundballs, with a wRC+ of 68. In 2024, he hit his grounders harder than usual, but not the hardest he’s ever hit them. It’s just a fun fact—one that you can use at holiday parties to signal to people that they shouldn’t waste any more time talking to you. Having the ability to successfully chat people up is a useful gift, but even more useful is the ability to say something so specifically meaningless that they’ll leave you alone. That’s our goal for the day. We’re ice fishing for fun, useless stats. Here's our second stupid fact of the day. Stathead has a split finder feature, in which it separates pitchers into groundball pitchers or fly ball pitchers. Against fly ball pitchers, the Twins were the best team in baseball. Their .782 OPS was the highest in the league, and their 114 home runs trailed only the Yankees. That part makes sense. The Twins have cultivated a team full of hitters who try to pull the ball in the air. They’re going to fare well against pitchers who throw four-seamers up in the zone. If we look in the other direction, you won’t be surprised to learn that against groundball pitchers, the Twins ranked all the way down at 25th, with a .667 OPS. In fact, if you look at the past five seasons, the Twins still rank all the way down at 25th. That’s one of the dangers of cultivating a team with a singular focus, rather than a diversity of approaches and swing paths. Everyone will have the same weakness. Wait, we’re coming dangerously close to pulling a lesson from our statistics, and that’s not what we’re going for at all. Let’s get back to nonsense: You know how the Twins were the best team in baseball against fly ball pitchers? Well they also grounded into the most double plays against fly ball pitchers. They grounded into 60 double plays against fly ball pitchers. How is that even possible? Against groundball pitchers, they ranked all the way down at 21st!- 2 comments
-
- 3
-

-
- byron buxton
- matt wallner
- (and 3 more)
-
Look, it's a long offseason. Use this information to impress your Twins fan friends and repel everyone else on earth. Image courtesy of © Jordan Johnson-Imagn Images Did you know that in 2024, Byron Buxton was the best ground-ball hitter in baseball? Of course you didn’t know that. Why would anyone know that? It’s information that offers no tangible benefit to anyone. It barely qualifies as trivia. But now you know it. In 2024, Buxton hit 75 ground balls, and on those ground balls, he batted .400 with an absurd 155 wRC+. The league as a whole batted .249, with a wRC+ of just 41. Buxton was more than three times better than the average player! To be clear, this means nothing at all. Buxton is a career .304 hitter on groundballs, with a wRC+ of 68. In 2024, he hit his grounders harder than usual, but not the hardest he’s ever hit them. It’s just a fun fact—one that you can use at holiday parties to signal to people that they shouldn’t waste any more time talking to you. Having the ability to successfully chat people up is a useful gift, but even more useful is the ability to say something so specifically meaningless that they’ll leave you alone. That’s our goal for the day. We’re ice fishing for fun, useless stats. Here's our second stupid fact of the day. Stathead has a split finder feature, in which it separates pitchers into groundball pitchers or fly ball pitchers. Against fly ball pitchers, the Twins were the best team in baseball. Their .782 OPS was the highest in the league, and their 114 home runs trailed only the Yankees. That part makes sense. The Twins have cultivated a team full of hitters who try to pull the ball in the air. They’re going to fare well against pitchers who throw four-seamers up in the zone. If we look in the other direction, you won’t be surprised to learn that against groundball pitchers, the Twins ranked all the way down at 25th, with a .667 OPS. In fact, if you look at the past five seasons, the Twins still rank all the way down at 25th. That’s one of the dangers of cultivating a team with a singular focus, rather than a diversity of approaches and swing paths. Everyone will have the same weakness. Wait, we’re coming dangerously close to pulling a lesson from our statistics, and that’s not what we’re going for at all. Let’s get back to nonsense: You know how the Twins were the best team in baseball against fly ball pitchers? Well they also grounded into the most double plays against fly ball pitchers. They grounded into 60 double plays against fly ball pitchers. How is that even possible? Against groundball pitchers, they ranked all the way down at 21st! View full article
-
In 2024, the Minnesota staff sat at the top of the league in several categories. What can that tell us about the organization as a whole? Image courtesy of © Mark J. Rebilas-Imagn Images I don’t know if I’m alone in this, but I love looking at the pitching or hitting stats for an entire team. I think it might have started because of the 2023 Braves, who just raked all season long from top to bottom, but I love going over to the League Statistics pages on Statcast and sorting by all the different columns. Every team is made up dozens of players with their own individual styles and skill levels, but I like to think of each team as its own little ecosystem. The players themselves and the way they develop are informed by the environment the team provides. For example, the Twins prize velocity and prefer four-seam fastballs, and that has informed both the pitchers they’ve acquired and what they’ve taught their young pitchers once they got them. I bring all this up because, as I was sorting the other day, I noticed something interesting. That one interesting thing took me down an entire rabbit hole, and I am now going to drag you down with me. Here’s where it started: I noticed that this season, opposing batters loved to swing at the Twins’ pitches. Their 49.7% swing rate trailed only the Mariners, whose opponents swung almost exactly 50% of the time. To tell you the truth, I’m not positive what that super-high swing rate means. Maybe it doesn’t mean anything. It definitely makes sense, in that the Twins threw a lot of strikes. Their 50.6% zone rate ranked third in baseball, behind the Rays and the Red Sox. But it wasn’t quite as simple as, "They threw strikes, so their opponents swung more often." The Twins ranked third in swing rate both inside and outside the zone. Awhile back I did a study about which stadiums have the best batter’s eye in center field, and therefore make it easier to see the ball. One way I measured that was to check the batters’ plate discipline, thinking that at ballparks where the batters could see the ball better, they’d make better swing decisions. But that turned out to be wrong. When batters could see the ball better, they swung more often at offerings both inside and outside the zone. The ball just looked juicier to them, so they swung more. This is purely a guess, but maybe the Twins’ high swing rate meant that they lacked deception, or that their pitches were somewhat predictable. Here's another strange thing: When you think of teams who hit the strike zone a lot, you probably think of teams who throw a lot of fastballs, since breaking and offspeed pitches are so often designed to generate chases and whiffs. But you’d be wrong (and by you, I actually mean me, because that’s what I thought until I looked it up). The Twins threw a four-seamer, sinker, or cutter 49.3% of the time, lowest in all of baseball. The league average was nearly 56%. The Twins hit the strike zone a ton even though they threw fewer fastballs than any other team in baseball. View full article
-
What Team Stats Can Tell Us About the Twins’ Pitching Philosophy
Davy Andrews posted an article in Caretakers
.png.7319f691a8b0c62e6648d929321a99d2.png) I don’t know if I’m alone in this, but I love looking at the pitching or hitting stats for an entire team. I think it might have started because of the 2023 Braves, who just raked all season long from top to bottom, but I love going over to the League Statistics pages on Statcast and sorting by all the different columns. Every team is made up dozens of players with their own individual styles and skill levels, but I like to think of each team as its own little ecosystem. The players themselves and the way they develop are informed by the environment the team provides. For example, the Twins prize velocity and prefer four-seam fastballs, and that has informed both the pitchers they’ve acquired and what they’ve taught their young pitchers once they got them. I bring all this up because, as I was sorting the other day, I noticed something interesting. That one interesting thing took me down an entire rabbit hole, and I am now going to drag you down with me. Here’s where it started: I noticed that this season, opposing batters loved to swing at the Twins’ pitches. Their 49.7% swing rate trailed only the Mariners, whose opponents swung almost exactly 50% of the time. To tell you the truth, I’m not positive what that super-high swing rate means. Maybe it doesn’t mean anything. It definitely makes sense, in that the Twins threw a lot of strikes. Their 50.6% zone rate ranked third in baseball, behind the Rays and the Red Sox. But it wasn’t quite as simple as, "They threw strikes, so their opponents swung more often." The Twins ranked third in swing rate both inside and outside the zone. Awhile back I did a study about which stadiums have the best batter’s eye in center field, and therefore make it easier to see the ball. One way I measured that was to check the batters’ plate discipline, thinking that at ballparks where the batters could see the ball better, they’d make better swing decisions. But that turned out to be wrong. When batters could see the ball better, they swung more often at offerings both inside and outside the zone. The ball just looked juicier to them, so they swung more. This is purely a guess, but maybe the Twins’ high swing rate meant that they lacked deception, or that their pitches were somewhat predictable. Here's another strange thing: When you think of teams who hit the strike zone a lot, you probably think of teams who throw a lot of fastballs, since breaking and offspeed pitches are so often designed to generate chases and whiffs. But you’d be wrong (and by you, I actually mean me, because that’s what I thought until I looked it up). The Twins threw a four-seamer, sinker, or cutter 49.3% of the time, lowest in all of baseball. The league average was nearly 56%. The Twins hit the strike zone a ton even though they threw fewer fastballs than any other team in baseball.
I don’t know if I’m alone in this, but I love looking at the pitching or hitting stats for an entire team. I think it might have started because of the 2023 Braves, who just raked all season long from top to bottom, but I love going over to the League Statistics pages on Statcast and sorting by all the different columns. Every team is made up dozens of players with their own individual styles and skill levels, but I like to think of each team as its own little ecosystem. The players themselves and the way they develop are informed by the environment the team provides. For example, the Twins prize velocity and prefer four-seam fastballs, and that has informed both the pitchers they’ve acquired and what they’ve taught their young pitchers once they got them. I bring all this up because, as I was sorting the other day, I noticed something interesting. That one interesting thing took me down an entire rabbit hole, and I am now going to drag you down with me. Here’s where it started: I noticed that this season, opposing batters loved to swing at the Twins’ pitches. Their 49.7% swing rate trailed only the Mariners, whose opponents swung almost exactly 50% of the time. To tell you the truth, I’m not positive what that super-high swing rate means. Maybe it doesn’t mean anything. It definitely makes sense, in that the Twins threw a lot of strikes. Their 50.6% zone rate ranked third in baseball, behind the Rays and the Red Sox. But it wasn’t quite as simple as, "They threw strikes, so their opponents swung more often." The Twins ranked third in swing rate both inside and outside the zone. Awhile back I did a study about which stadiums have the best batter’s eye in center field, and therefore make it easier to see the ball. One way I measured that was to check the batters’ plate discipline, thinking that at ballparks where the batters could see the ball better, they’d make better swing decisions. But that turned out to be wrong. When batters could see the ball better, they swung more often at offerings both inside and outside the zone. The ball just looked juicier to them, so they swung more. This is purely a guess, but maybe the Twins’ high swing rate meant that they lacked deception, or that their pitches were somewhat predictable. Here's another strange thing: When you think of teams who hit the strike zone a lot, you probably think of teams who throw a lot of fastballs, since breaking and offspeed pitches are so often designed to generate chases and whiffs. But you’d be wrong (and by you, I actually mean me, because that’s what I thought until I looked it up). The Twins threw a four-seamer, sinker, or cutter 49.3% of the time, lowest in all of baseball. The league average was nearly 56%. The Twins hit the strike zone a ton even though they threw fewer fastballs than any other team in baseball. -
Why did the advanced metrics love the Twins' pitching staff so much more than the traditional ones? Image courtesy of © Jesse Johnson-Imagn Images The Twins' pitching staff ran a 4.26 ERA in 2024. That ranked just 21st in baseball, and it was one of the reasons they missed the playoffs. In fact, here’s the list of playoff teams that had a worse ERA than the Twins: nobody. Not a single playoff team had a worse ERA than the Twins. Want to play in October? You need to pitch well. However, it’s not quite that simple. As our knowledge of the game’s intricacies has advanced, ERA has fallen from its place of prominence. A wide variety of ERA estimators attempt to account for factors outside the pitcher’s control—defense, batted ball luck, sequencing, park factors—in order to get a better idea of what the pitcher actually did right or wrong. Fielding-independent pitching (FIP) looks only at the three true outcomes of walks, homers, and strikeouts (as well as the long-slighted fourth true outcome, hit-by-pitches; what could be truer than throwing a baseball directly into the flesh of a fellow human being?). FIP has long been known to be more predictive of a pitcher’s future performance than ERA. xFIP takes things a step further. It replaces a pitcher’s actual home run total with the number of dingers that Statcast thinks they deserved to give up. I bring all this up because if you look at these estimators, you’ll see that they tell a very different story about the Twins staff (and season) than their ERA does. The table below shows how the team fared according to various stats. The first row shows the raw numbers, and the second shows their rank among all MLB teams. Calling the difference stark would really be underselling things. Metric ERA FIP xFIP DRA SIERA ERA- FIP- xFIP- DRA- Raw 4.26 3.84 3.83 4.14 3.65 106 94 94 93 Rank 21 7 5 4 3 22 6 4 4 Nearly every advanced metric thinks that the Twins had a top-five pitching staff in 2024. Top five! How did they end up ranked 21st in ERA? View full article
-
.png.10ac39223da3cd2cbe9408631355cb87.png) The Twins' pitching staff ran a 4.26 ERA in 2024. That ranked just 21st in baseball, and it was one of the reasons they missed the playoffs. In fact, here’s the list of playoff teams that had a worse ERA than the Twins: nobody. Not a single playoff team had a worse ERA than the Twins. Want to play in October? You need to pitch well. However, it’s not quite that simple. As our knowledge of the game’s intricacies has advanced, ERA has fallen from its place of prominence. A wide variety of ERA estimators attempt to account for factors outside the pitcher’s control—defense, batted ball luck, sequencing, park factors—in order to get a better idea of what the pitcher actually did right or wrong. Fielding-independent pitching (FIP) looks only at the three true outcomes of walks, homers, and strikeouts (as well as the long-slighted fourth true outcome, hit-by-pitches; what could be truer than throwing a baseball directly into the flesh of a fellow human being?). FIP has long been known to be more predictive of a pitcher’s future performance than ERA. xFIP takes things a step further. It replaces a pitcher’s actual home run total with the number of dingers that Statcast thinks they deserved to give up. I bring all this up because if you look at these estimators, you’ll see that they tell a very different story about the Twins staff (and season) than their ERA does. The table below shows how the team fared according to various stats. The first row shows the raw numbers, and the second shows their rank among all MLB teams. Calling the difference stark would really be underselling things. Metric ERA FIP xFIP DRA SIERA ERA- FIP- xFIP- DRA- Raw 4.26 3.84 3.83 4.14 3.65 106 94 94 93 Rank 21 7 5 4 3 22 6 4 4 Nearly every advanced metric thinks that the Twins had a top-five pitching staff in 2024. Top five! How did they end up ranked 21st in ERA?
The Twins' pitching staff ran a 4.26 ERA in 2024. That ranked just 21st in baseball, and it was one of the reasons they missed the playoffs. In fact, here’s the list of playoff teams that had a worse ERA than the Twins: nobody. Not a single playoff team had a worse ERA than the Twins. Want to play in October? You need to pitch well. However, it’s not quite that simple. As our knowledge of the game’s intricacies has advanced, ERA has fallen from its place of prominence. A wide variety of ERA estimators attempt to account for factors outside the pitcher’s control—defense, batted ball luck, sequencing, park factors—in order to get a better idea of what the pitcher actually did right or wrong. Fielding-independent pitching (FIP) looks only at the three true outcomes of walks, homers, and strikeouts (as well as the long-slighted fourth true outcome, hit-by-pitches; what could be truer than throwing a baseball directly into the flesh of a fellow human being?). FIP has long been known to be more predictive of a pitcher’s future performance than ERA. xFIP takes things a step further. It replaces a pitcher’s actual home run total with the number of dingers that Statcast thinks they deserved to give up. I bring all this up because if you look at these estimators, you’ll see that they tell a very different story about the Twins staff (and season) than their ERA does. The table below shows how the team fared according to various stats. The first row shows the raw numbers, and the second shows their rank among all MLB teams. Calling the difference stark would really be underselling things. Metric ERA FIP xFIP DRA SIERA ERA- FIP- xFIP- DRA- Raw 4.26 3.84 3.83 4.14 3.65 106 94 94 93 Rank 21 7 5 4 3 22 6 4 4 Nearly every advanced metric thinks that the Twins had a top-five pitching staff in 2024. Top five! How did they end up ranked 21st in ERA? -
The Twins Didn’t Bunt at All, Because the Twins Couldn’t Bunt, at All
Davy Andrews posted an article in Caretakers
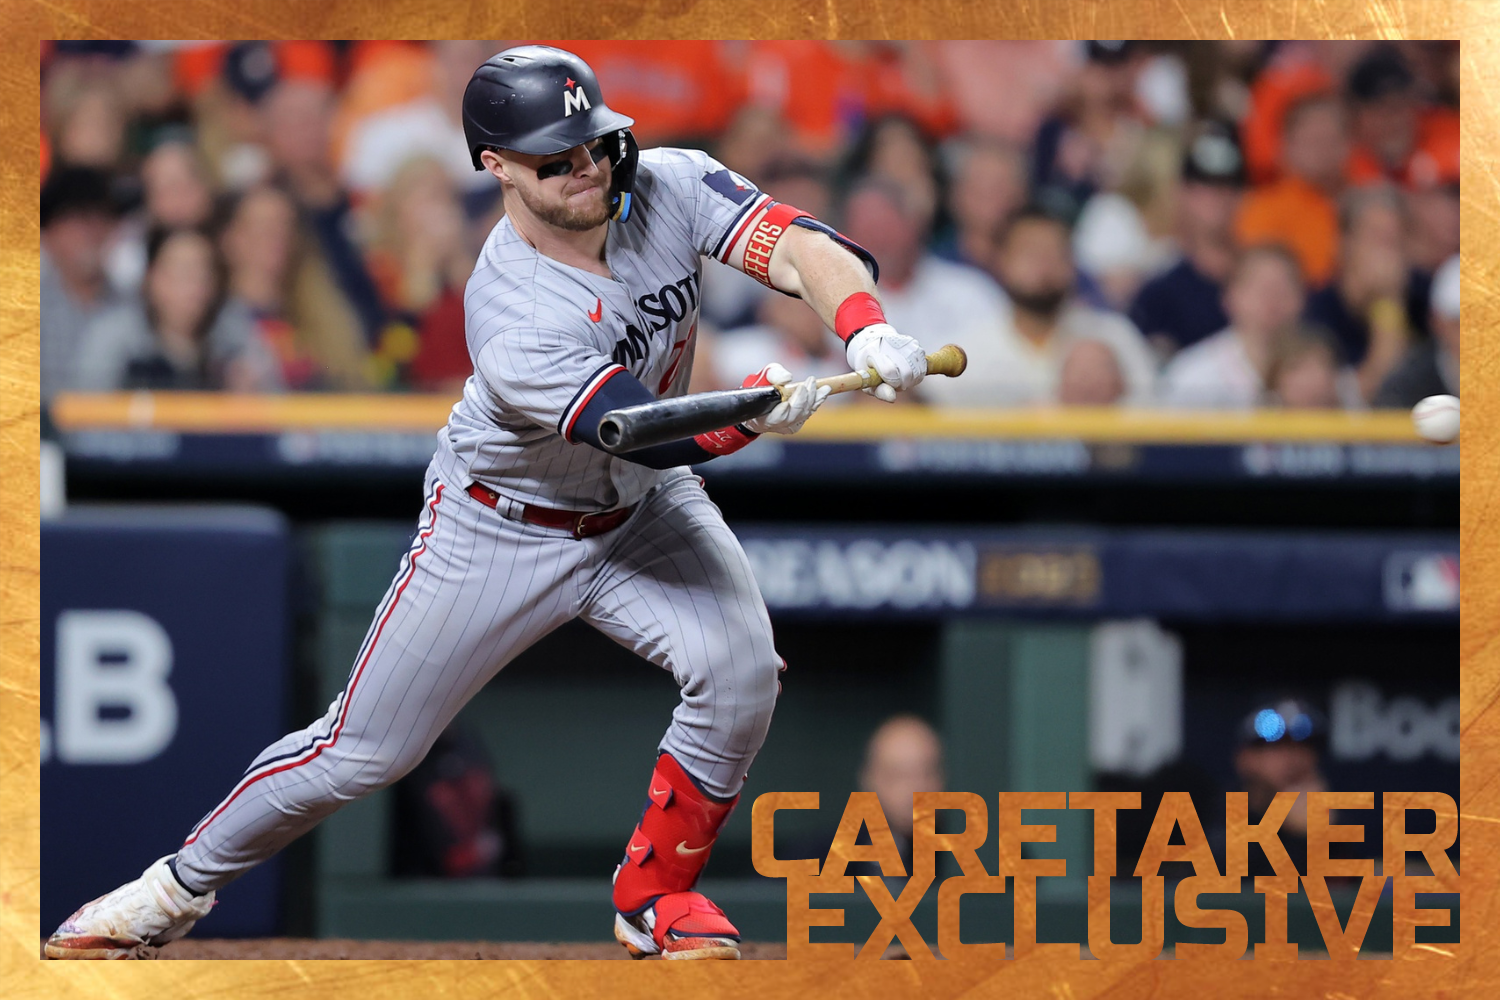 You probably know that the Twins weren’t big bunters in 2024. But did you know that they had just two bunt hits all season? Two bunts! You can count them on one hand, even if you’re a lobster. As you might have guessed, that was the lowest total in the league. Most teams had more than 10. Forty-nine different individual players had more bunt base hits than the entire Twins team. We started tracking these things in 2002, and if you throw out the short 2020 season, the 2018 A’s are the only team that has ever had fewer bunt hits. They had zero. The Twins bunted just 24 times in total, the sixth-lowest mark in baseball. Still, while the absolute number is extreme, it’s not surprising that the Twins didn’t bunt a lot. For starters, they weren’t built for small ball. They had a top-10 offense with a lot of power but not much speed. Actually, that doesn’t quite do justice to the reality of the situation, so let me phrase it differently: the Twins had no speed whatsoever. They ranked last in sprint speed, stolen bases, and stolen base attempts, and they ranked in the bottom five in success rate and overall baserunning value. Moreover, the team’s only real burner, Byron Buxton, was also its best power hitter. Nobody would recommend taking the bat out of Buxton’s hands. Plenty of us enjoy watching more of an old-school approach, but with a roster like Minnesota’s, bunting regularly would have been downright irresponsible. The numbers bear that out and then some. FanGraphs tracks the percentage of your bunts that go for hits, and Statcast allows you to find the batting average of a team’s bunts. The majority of the teams in the league had a bunt hit rate above 30% and a batting average on bunts above .460. The Twins were at 8% and .143, the worst in baseball on both counts. I also made my own bunt success metric. Even though the numbers say that sacrifice bunts aren’t necessarily the smart play, I wanted to give teams credit for succeeding or failing at whatever they were trying to do. To that effect, I took each team’s total number of bunts, then I subtracted their bunt base hits, successful sacrifice bunts, and bunts where the batter reached on an error. That left just the bunts that ended up as regular old outs, either because a base hit attempt or a sacrifice attempt didn’t work out. Then I divided that number by the total number of bunts. For the Twins, it was 50%. Half of the time, their bunts were total failures. Only the Red Sox, whose bunts failed a catastrophic 56% of the time, were worse. Atlanta finished in first place with an astonishing 11%. Just two of their 18 bunts ended up as failures. Just to recap what we’ve established so far, the Twins didn’t bunt much because they were super slow. And as expected, on the rare occasions when they did bunt, things went very, very badly. You could make a strong argument that when they got a bunt down, no team in baseball was worse than the Twins. But this story has a surprise twist! Are you ready? The Twins were extremely unsuccessful when they got a bunt down, BUT they were the best team in baseball at getting the bunt down!
 -
The Twins were uniquely bad at bunting in 2024, but they also might have been uniquely good at bunting. Image courtesy of © Erik Williams-Imagn Images You probably know that the Twins weren’t big bunters in 2024. But did you know that they had just two bunt hits all season? Two bunts! You can count them on one hand, even if you’re a lobster. As you might have guessed, that was the lowest total in the league. Most teams had more than 10. Forty-nine different individual players had more bunt base hits than the entire Twins team. We started tracking these things in 2002, and if you throw out the short 2020 season, the 2018 A’s are the only team that has ever had fewer bunt hits. They had zero. The Twins bunted just 24 times in total, the sixth-lowest mark in baseball. Still, while the absolute number is extreme, it’s not surprising that the Twins didn’t bunt a lot. For starters, they weren’t built for small ball. They had a top-10 offense with a lot of power but not much speed. Actually, that doesn’t quite do justice to the reality of the situation, so let me phrase it differently: the Twins had no speed whatsoever. They ranked last in sprint speed, stolen bases, and stolen base attempts, and they ranked in the bottom five in success rate and overall baserunning value. Moreover, the team’s only real burner, Byron Buxton, was also its best power hitter. Nobody would recommend taking the bat out of Buxton’s hands. Plenty of us enjoy watching more of an old-school approach, but with a roster like Minnesota’s, bunting regularly would have been downright irresponsible. The numbers bear that out and then some. FanGraphs tracks the percentage of your bunts that go for hits, and Statcast allows you to find the batting average of a team’s bunts. The majority of the teams in the league had a bunt hit rate above 30% and a batting average on bunts above .460. The Twins were at 8% and .143, the worst in baseball on both counts. I also made my own bunt success metric. Even though the numbers say that sacrifice bunts aren’t necessarily the smart play, I wanted to give teams credit for succeeding or failing at whatever they were trying to do. To that effect, I took each team’s total number of bunts, then I subtracted their bunt base hits, successful sacrifice bunts, and bunts where the batter reached on an error. That left just the bunts that ended up as regular old outs, either because a base hit attempt or a sacrifice attempt didn’t work out. Then I divided that number by the total number of bunts. For the Twins, it was 50%. Half of the time, their bunts were total failures. Only the Red Sox, whose bunts failed a catastrophic 56% of the time, were worse. Atlanta finished in first place with an astonishing 11%. Just two of their 18 bunts ended up as failures. Just to recap what we’ve established so far, the Twins didn’t bunt much because they were super slow. And as expected, on the rare occasions when they did bunt, things went very, very badly. You could make a strong argument that when they got a bunt down, no team in baseball was worse than the Twins. But this story has a surprise twist! Are you ready? The Twins were extremely unsuccessful when they got a bunt down, BUT they were the best team in baseball at getting the bunt down! View full article
-
An End-Of-Season Update on Trevor Larnach's Soft Stuff Struggles
Davy Andrews posted an article in Caretakers
.png.9c11934e30b30db3c4d93c828771cd7a.png) Let’s take a moment to make sure that we appreciate how good a season Trevor Larnach just had. Before the 2024 season, Larnach had played in 188 big-league games over three seasons, running a 96 wRC+ that made him a slightly below-average hitter. In 2024, despite dealing with injuries and some bad batted-ball luck, he put up a wRC+ of 121 over 112 games and 400 plate appearances. That made him the fourth-best hitter on a Twins team that finished the season with a top-10 offense. Look at the difference in his slash line stats. Season AVG OBP SLG wRC+ 2021-2023 .222 .315 .385 96 2024 .259 .338 .434 121 Difference .037 .023 .049 25 Larnach added 37 points of batting average, 23 points of on-base percentage, and 49 points of slugging. After striking out more than a third of the time in his first three seasons, he dropped his strikeout rate all the way to 22%. That was a huge improvement, and it was also absolutely necessary. His defensive limitations mean that in order to pull his own weight, the 6-foot-4, 223-pound Larnach needs to slug, so it’s a big deal that after three years of trying, he was finally able to do so. If you had to pick one player who epitomized the Minnesota offense, you’d likely go with Matt Wallner, the hot and cold slugger who struck out too much but pulled the ball in the air with unbelievable frequency. Larnach wouldn’t be a bad avatar for the team’s offense either, and not just because he hit well despite struggling to stay healthy. In 2024, 37% of the pitches Larnach saw were either four-seamers or sinkers. Among players who saw at least 750 pitches (roughly 170 plate appearances), that was the lowest fastball rate in all of baseball. In fact, that fastball rate is one of the lowest ever recorded. Sports Info Solutions has been tracking pitches since 2002. Over those 23 years, there have been 4,625 player seasons of at least 400 PAs. Larnach’s fastball rate ranks second from the bottom. That last part shouldn’t necessarily be surprising, because fastball rates have been dropping for as long as we’ve been measuring them, and most likely ever since the game began. In 2024, Larnach almost certainly ran one of the lowest fastball rates in all of baseball history. As for why that makes him a good representative for the Twins, well, Larnach wasn’t exactly alone. As a team, the Twins saw fastballs just 44.8% of the time, the second-lowest rate in the league. They were the only team in baseball without a single player who took at least 15 PAs and had a fastball rate of 50% or higher. Austin Martin came closest. He saw 466 fastballs and 468 other pitches; if just one got reclassified, he’d be at 50%, exactly. Player Fastball% Player Fastball% Austin Martin 49.9 Max Kepler 44.9 Ryan Jeffers 49 Byron Buxton 45.1 Kyle Farmer 48.8 Royce Lewis 43.9 Christian Vázquez 48.8 Jose Miranda 43.7 Manuel Margot 48.5 Alex Kirilloff 39.7 Carlos Correa 47 Edouard Julien 40.8 Matt Wallner 45.8 Carlos Santana 40.7 Willi Castro 46 Trevor Larnach 36.8 Brooks Lee 45.4
Let’s take a moment to make sure that we appreciate how good a season Trevor Larnach just had. Before the 2024 season, Larnach had played in 188 big-league games over three seasons, running a 96 wRC+ that made him a slightly below-average hitter. In 2024, despite dealing with injuries and some bad batted-ball luck, he put up a wRC+ of 121 over 112 games and 400 plate appearances. That made him the fourth-best hitter on a Twins team that finished the season with a top-10 offense. Look at the difference in his slash line stats. Season AVG OBP SLG wRC+ 2021-2023 .222 .315 .385 96 2024 .259 .338 .434 121 Difference .037 .023 .049 25 Larnach added 37 points of batting average, 23 points of on-base percentage, and 49 points of slugging. After striking out more than a third of the time in his first three seasons, he dropped his strikeout rate all the way to 22%. That was a huge improvement, and it was also absolutely necessary. His defensive limitations mean that in order to pull his own weight, the 6-foot-4, 223-pound Larnach needs to slug, so it’s a big deal that after three years of trying, he was finally able to do so. If you had to pick one player who epitomized the Minnesota offense, you’d likely go with Matt Wallner, the hot and cold slugger who struck out too much but pulled the ball in the air with unbelievable frequency. Larnach wouldn’t be a bad avatar for the team’s offense either, and not just because he hit well despite struggling to stay healthy. In 2024, 37% of the pitches Larnach saw were either four-seamers or sinkers. Among players who saw at least 750 pitches (roughly 170 plate appearances), that was the lowest fastball rate in all of baseball. In fact, that fastball rate is one of the lowest ever recorded. Sports Info Solutions has been tracking pitches since 2002. Over those 23 years, there have been 4,625 player seasons of at least 400 PAs. Larnach’s fastball rate ranks second from the bottom. That last part shouldn’t necessarily be surprising, because fastball rates have been dropping for as long as we’ve been measuring them, and most likely ever since the game began. In 2024, Larnach almost certainly ran one of the lowest fastball rates in all of baseball history. As for why that makes him a good representative for the Twins, well, Larnach wasn’t exactly alone. As a team, the Twins saw fastballs just 44.8% of the time, the second-lowest rate in the league. They were the only team in baseball without a single player who took at least 15 PAs and had a fastball rate of 50% or higher. Austin Martin came closest. He saw 466 fastballs and 468 other pitches; if just one got reclassified, he’d be at 50%, exactly. Player Fastball% Player Fastball% Austin Martin 49.9 Max Kepler 44.9 Ryan Jeffers 49 Byron Buxton 45.1 Kyle Farmer 48.8 Royce Lewis 43.9 Christian Vázquez 48.8 Jose Miranda 43.7 Manuel Margot 48.5 Alex Kirilloff 39.7 Carlos Correa 47 Edouard Julien 40.8 Matt Wallner 45.8 Carlos Santana 40.7 Willi Castro 46 Trevor Larnach 36.8 Brooks Lee 45.4 -
Trevor Larnach improved against soft stuff in 2024, but he still saw more of it than just about any other player. Ever. Image courtesy of © Orlando Ramirez-Imagn Images Let’s take a moment to make sure that we appreciate how good a season Trevor Larnach just had. Before the 2024 season, Larnach had played in 188 big-league games over three seasons, running a 96 wRC+ that made him a slightly below-average hitter. In 2024, despite dealing with injuries and some bad batted-ball luck, he put up a wRC+ of 121 over 112 games and 400 plate appearances. That made him the fourth-best hitter on a Twins team that finished the season with a top-10 offense. Look at the difference in his slash line stats. Season AVG OBP SLG wRC+ 2021-2023 .222 .315 .385 96 2024 .259 .338 .434 121 Difference .037 .023 .049 25 Larnach added 37 points of batting average, 23 points of on-base percentage, and 49 points of slugging. After striking out more than a third of the time in his first three seasons, he dropped his strikeout rate all the way to 22%. That was a huge improvement, and it was also absolutely necessary. His defensive limitations mean that in order to pull his own weight, the 6-foot-4, 223-pound Larnach needs to slug, so it’s a big deal that after three years of trying, he was finally able to do so. If you had to pick one player who epitomized the Minnesota offense, you’d likely go with Matt Wallner, the hot and cold slugger who struck out too much but pulled the ball in the air with unbelievable frequency. Larnach wouldn’t be a bad avatar for the team’s offense either, and not just because he hit well despite struggling to stay healthy. In 2024, 37% of the pitches Larnach saw were either four-seamers or sinkers. Among players who saw at least 750 pitches (roughly 170 plate appearances), that was the lowest fastball rate in all of baseball. In fact, that fastball rate is one of the lowest ever recorded. Sports Info Solutions has been tracking pitches since 2002. Over those 23 years, there have been 4,625 player seasons of at least 400 PAs. Larnach’s fastball rate ranks second from the bottom. That last part shouldn’t necessarily be surprising, because fastball rates have been dropping for as long as we’ve been measuring them, and most likely ever since the game began. In 2024, Larnach almost certainly ran one of the lowest fastball rates in all of baseball history. As for why that makes him a good representative for the Twins, well, Larnach wasn’t exactly alone. As a team, the Twins saw fastballs just 44.8% of the time, the second-lowest rate in the league. They were the only team in baseball without a single player who took at least 15 PAs and had a fastball rate of 50% or higher. Austin Martin came closest. He saw 466 fastballs and 468 other pitches; if just one got reclassified, he’d be at 50%, exactly. Player Fastball% Player Fastball% Austin Martin 49.9 Max Kepler 44.9 Ryan Jeffers 49 Byron Buxton 45.1 Kyle Farmer 48.8 Royce Lewis 43.9 Christian Vázquez 48.8 Jose Miranda 43.7 Manuel Margot 48.5 Alex Kirilloff 39.7 Carlos Correa 47 Edouard Julien 40.8 Matt Wallner 45.8 Carlos Santana 40.7 Willi Castro 46 Trevor Larnach 36.8 Brooks Lee 45.4 View full article
-
.png.627b67d59f542244de2f7a1bd0277b4c.png) So let’s start at the beginning. Going by weighted on-base percentage (wOBA, if you’re in a hurry), here’s the value of each kind of batted ball during the 2024 season. Groundball: .228 Line Drive: .642 Fly Ball: .420 Popup: .014 Fly balls are good. Line drives are great. So long as you don’t pop the ball up, hitting the ball in the air is where it’s at. Let’s get a little bit more granular, now, and break down those air balls by spray angle. Pull: .792 Straightaway: .427 Opposite. 362 All three are still great, but pulling the ball in the air is even more where it's at; it's where "where it's at" is at. There are two big reasons for that: First, you tend to hit the ball harder when you pull it. Second, center field is where the fence is deepest and the best outfielders play. Even though pulled balls are hit harder, this season, the average pulled home run was hit at an exit velocity of 104.2 mph, while the average home run to center was hit 105.9 mph. It just takes more mustard to hit it out to center. Maybe you hate the focus on power and launch angle that has taken over the game, for aesthetic reasons. That’s completely understandable. But the numbers above are too clear to ignore. They’re why everybody is trying to pull the ball in the air. So far, I’m guessing I haven’t surprised you, but maybe you will be surprised to learn that in 2024, no team pulled the ball in the air as much as the Twins. The Twins pulled 819 line drives and fly balls, which represented 7.2% of their swings, 13.4% of their total plate appearances, and 19.3% of their batted balls. All four of those numbers were the highest in baseball. Everybody is trying to pull the ball in the air, and the Twins were the most successful team in the league, not just this season, but in the entirety of the Statcast Era. Since Statcast started measuring these things in 2015, that 13.4% mark is the highest in baseball. In second place? The 2019 Twins, who pulled the ball in the air in 13.1% of their plate appearances, and who inspired Matt Trueblood to coin the statistical phrase "Bomba Rate". In today’s game, Isaac Paredes is the poster boy for pulling the ball in the air. Doing so allows him to hit the ball out of the ballpark even when he doesn’t get all of it. In 2024, Paredes’s average home run was hit at just 99.8 mph. He was the only player in baseball who hit more than 15 homers and whose homers had an average exit velocity under 100 mph. That’s his specialty, and when Paredes put the ball in the play, he pulled it in the air 28.9% of the time, the highest rate of all qualified players. But you know what the Twins specialized in last season? Players who didn’t get enough playing time to qualify. If we drop the batted ball minimum to 200, Byron Buxton jumps into first place at 29.1%. That’s right, higher than Paredes.
So let’s start at the beginning. Going by weighted on-base percentage (wOBA, if you’re in a hurry), here’s the value of each kind of batted ball during the 2024 season. Groundball: .228 Line Drive: .642 Fly Ball: .420 Popup: .014 Fly balls are good. Line drives are great. So long as you don’t pop the ball up, hitting the ball in the air is where it’s at. Let’s get a little bit more granular, now, and break down those air balls by spray angle. Pull: .792 Straightaway: .427 Opposite. 362 All three are still great, but pulling the ball in the air is even more where it's at; it's where "where it's at" is at. There are two big reasons for that: First, you tend to hit the ball harder when you pull it. Second, center field is where the fence is deepest and the best outfielders play. Even though pulled balls are hit harder, this season, the average pulled home run was hit at an exit velocity of 104.2 mph, while the average home run to center was hit 105.9 mph. It just takes more mustard to hit it out to center. Maybe you hate the focus on power and launch angle that has taken over the game, for aesthetic reasons. That’s completely understandable. But the numbers above are too clear to ignore. They’re why everybody is trying to pull the ball in the air. So far, I’m guessing I haven’t surprised you, but maybe you will be surprised to learn that in 2024, no team pulled the ball in the air as much as the Twins. The Twins pulled 819 line drives and fly balls, which represented 7.2% of their swings, 13.4% of their total plate appearances, and 19.3% of their batted balls. All four of those numbers were the highest in baseball. Everybody is trying to pull the ball in the air, and the Twins were the most successful team in the league, not just this season, but in the entirety of the Statcast Era. Since Statcast started measuring these things in 2015, that 13.4% mark is the highest in baseball. In second place? The 2019 Twins, who pulled the ball in the air in 13.1% of their plate appearances, and who inspired Matt Trueblood to coin the statistical phrase "Bomba Rate". In today’s game, Isaac Paredes is the poster boy for pulling the ball in the air. Doing so allows him to hit the ball out of the ballpark even when he doesn’t get all of it. In 2024, Paredes’s average home run was hit at just 99.8 mph. He was the only player in baseball who hit more than 15 homers and whose homers had an average exit velocity under 100 mph. That’s his specialty, and when Paredes put the ball in the play, he pulled it in the air 28.9% of the time, the highest rate of all qualified players. But you know what the Twins specialized in last season? Players who didn’t get enough playing time to qualify. If we drop the batted ball minimum to 200, Byron Buxton jumps into first place at 29.1%. That’s right, higher than Paredes.- 10 comments
-
- 4
-
-
- byron buxton
- matt wallner
- (and 5 more)
-
In 2024, the Twins were the best team in baseball at pulling the ball in the air. With the entire hitting staff gone, what does that mean for the 2025 season? Image courtesy of © Jordan Johnson-Imagn Images So let’s start at the beginning. Going by weighted on-base percentage (wOBA, if you’re in a hurry), here’s the value of each kind of batted ball during the 2024 season. Groundball: .228 Line Drive: .642 Fly Ball: .420 Popup: .014 Fly balls are good. Line drives are great. So long as you don’t pop the ball up, hitting the ball in the air is where it’s at. Let’s get a little bit more granular, now, and break down those air balls by spray angle. Pull: .792 Straightaway: .427 Opposite. 362 All three are still great, but pulling the ball in the air is even more where it's at; it's where "where it's at" is at. There are two big reasons for that: First, you tend to hit the ball harder when you pull it. Second, center field is where the fence is deepest and the best outfielders play. Even though pulled balls are hit harder, this season, the average pulled home run was hit at an exit velocity of 104.2 mph, while the average home run to center was hit 105.9 mph. It just takes more mustard to hit it out to center. Maybe you hate the focus on power and launch angle that has taken over the game, for aesthetic reasons. That’s completely understandable. But the numbers above are too clear to ignore. They’re why everybody is trying to pull the ball in the air. So far, I’m guessing I haven’t surprised you, but maybe you will be surprised to learn that in 2024, no team pulled the ball in the air as much as the Twins. The Twins pulled 819 line drives and fly balls, which represented 7.2% of their swings, 13.4% of their total plate appearances, and 19.3% of their batted balls. All four of those numbers were the highest in baseball. Everybody is trying to pull the ball in the air, and the Twins were the most successful team in the league, not just this season, but in the entirety of the Statcast Era. Since Statcast started measuring these things in 2015, that 13.4% mark is the highest in baseball. In second place? The 2019 Twins, who pulled the ball in the air in 13.1% of their plate appearances, and who inspired Matt Trueblood to coin the statistical phrase "Bomba Rate". In today’s game, Isaac Paredes is the poster boy for pulling the ball in the air. Doing so allows him to hit the ball out of the ballpark even when he doesn’t get all of it. In 2024, Paredes’s average home run was hit at just 99.8 mph. He was the only player in baseball who hit more than 15 homers and whose homers had an average exit velocity under 100 mph. That’s his specialty, and when Paredes put the ball in the play, he pulled it in the air 28.9% of the time, the highest rate of all qualified players. But you know what the Twins specialized in last season? Players who didn’t get enough playing time to qualify. If we drop the batted ball minimum to 200, Byron Buxton jumps into first place at 29.1%. That’s right, higher than Paredes. View full article
-
The flame-throwing closer saw his release point — and his velocity — drop in 2024. How did that happen, and might be be able to raise them again? Image courtesy of © Jesse Johnson-Imagn Images Last week, Matthew Trueblood wrote about the importance of fastball shape, highlighting the particular attributes that the Twins prize most highly. Today, I’d like to look into the shape of the team’s most exciting fastball: Jhoan Durán’s four-seamer. First, let’s address the elephant in the room: Duran saw his ERA rise from 2.45 in 2023 to 3.64 in 2024. That’s not great, but if you’re reading this site, you probably know already that Duran dealt with some really bad luck. His FIP and xFIP were actually lower than in 2023. His .321 BABIP was higher than 85% of all pitchers (minimum 50 innings pitched). When batters put the ball in play, the 53-point difference between his wOBA and xwOBA was higher than 96% of all pitchers (minimum 100 batted balls). Results can be fluky--especially for relief pitchers, who have smaller sample sizes. I’d like to focus instead on process, because even if the results were influenced by luck, Durán’s fastball really did change shape this season. Let’s start with some cold, hard numbers, courtesy of Statcast’s new arm angle metrics. As you can see, the angle of Duran’s weird, black arm has fallen five degrees from last season. His vertical release point has fallen from 6.09 feet to 5.96 feet, a difference of 1.56 inches. To be clear, things aren't quite as simple as the graphic above makes them appear. Over the past two seasons, his release point has tended to fall throughout the year. Still, generally speaking, when a pitcher lowers their arm angle, they should expect less vertical break, more horizontal break, and less velocity. That’s exactly what happened to Duran’s four-seamer. View full article
-
Jhoan Duran’s Fastball Shape Is a Moving Target. Is That a Problem?
Davy Andrews posted an article in Caretakers
.png.08e619a3027be0343573a55d48460a8d.png) Last week, Matthew Trueblood wrote about the importance of fastball shape, highlighting the particular attributes that the Twins prize most highly. Today, I’d like to look into the shape of the team’s most exciting fastball: Jhoan Durán’s four-seamer. First, let’s address the elephant in the room: Duran saw his ERA rise from 2.45 in 2023 to 3.64 in 2024. That’s not great, but if you’re reading this site, you probably know already that Duran dealt with some really bad luck. His FIP and xFIP were actually lower than in 2023. His .321 BABIP was higher than 85% of all pitchers (minimum 50 innings pitched). When batters put the ball in play, the 53-point difference between his wOBA and xwOBA was higher than 96% of all pitchers (minimum 100 batted balls). Results can be fluky--especially for relief pitchers, who have smaller sample sizes. I’d like to focus instead on process, because even if the results were influenced by luck, Durán’s fastball really did change shape this season. Let’s start with some cold, hard numbers, courtesy of Statcast’s new arm angle metrics. As you can see, the angle of Duran’s weird, black arm has fallen five degrees from last season. His vertical release point has fallen from 6.09 feet to 5.96 feet, a difference of 1.56 inches. To be clear, things aren't quite as simple as the graphic above makes them appear. Over the past two seasons, his release point has tended to fall throughout the year. Still, generally speaking, when a pitcher lowers their arm angle, they should expect less vertical break, more horizontal break, and less velocity. That’s exactly what happened to Duran’s four-seamer.
Last week, Matthew Trueblood wrote about the importance of fastball shape, highlighting the particular attributes that the Twins prize most highly. Today, I’d like to look into the shape of the team’s most exciting fastball: Jhoan Durán’s four-seamer. First, let’s address the elephant in the room: Duran saw his ERA rise from 2.45 in 2023 to 3.64 in 2024. That’s not great, but if you’re reading this site, you probably know already that Duran dealt with some really bad luck. His FIP and xFIP were actually lower than in 2023. His .321 BABIP was higher than 85% of all pitchers (minimum 50 innings pitched). When batters put the ball in play, the 53-point difference between his wOBA and xwOBA was higher than 96% of all pitchers (minimum 100 batted balls). Results can be fluky--especially for relief pitchers, who have smaller sample sizes. I’d like to focus instead on process, because even if the results were influenced by luck, Durán’s fastball really did change shape this season. Let’s start with some cold, hard numbers, courtesy of Statcast’s new arm angle metrics. As you can see, the angle of Duran’s weird, black arm has fallen five degrees from last season. His vertical release point has fallen from 6.09 feet to 5.96 feet, a difference of 1.56 inches. To be clear, things aren't quite as simple as the graphic above makes them appear. Over the past two seasons, his release point has tended to fall throughout the year. Still, generally speaking, when a pitcher lowers their arm angle, they should expect less vertical break, more horizontal break, and less velocity. That’s exactly what happened to Duran’s four-seamer. -
.png.e933f059ef1380560858da5e114928eb.png) Something changed a few days from the end of the year, for Carlos Correa. Well, something changed back. Correa has been excellent all season, but he was even better after his return from the IL on Sept. 14. He ran a 172 wRC+ over the final fortnight, up from 153 before the injury, and his on-base percentage was a gaudy .460. Now, we’re talking about just 11 games and 50 plate appearances, and Correa ran an unsustainable ..387 BABIP over that period. However, I think there were some real changes going on--temporary changes, but real ones, nonetheless. When Correa returned from a two-month absence due to plantar fasciitis in his right foot, I checked in on his bat speed and noticed that it wasn’t far below his season average. However, I spoke too soon. The really useful thing about bat speed is that it stabilizes very quickly. You only need to see a player reach a bat speed of 88 mph one time to know that they’re capable of hitting the ball extremely hard. Correa’s bat speed before the injury was 74.7 mph, which put him in the 85th percentile. After his return, his bat speed has averaged 72.8 mph, which would drop him down to the 65th percentile. Before the injury, 48% of his swings were over 75 mph; when he came back, it was 28%. Watching Correa swing the bat these past two weeks, I don’t think the issue is that he can’t put everything into his swing. He hit the ball hard often enough, and his swing looked explosive at times. Back in May, Matt Trueblood noticed that Correa had started using a scissor kick, transferring his weight so aggressively that his right foot would slide backward, away from home plate, sometimes rising off the ground entirely. Correa is still using that move. Here he is doing so on Wednesday night. However, Correa still didn’t approach the highest bat speed that he’s capable of. While he was still scissoring, his back foot was rarely leaving the ground entirely. Correa’s hardest swing of the season was measured at 87 mph, and he’s had 50 that were measured at or above 80 mph this season. In September, however, the fastest swing he unleashed was 79.2 mph. It ranks as just his 72nd-hardest swing of the season. In fact, of his 100 hardest swings this season, just four came after his return. Statistically speaking, if nothing had changed at all, we would expect that number to be closer to 12. However, at this point, I need to remind you of how Statcast measures bat speed. The number you see indicates how fast the barrel is moving in the video frame where it’s closest to the ball, and many, many factors influence it. For example, because the bat keeps accelerating all the way through the hitting zone, pulled balls, which are necessarily hit out in front, will have a higher bat speed than balls hit the other way, which are usually caught deeper in the zone. The overarching theme of these factors is adjustments. When you're exactly on time and the ball is put right where you want it, you can get off the fastest swing of your life. The more you have to adjust your swing – maybe you’re late on a fastball, so you have to cheat to catch up to it; maybe you’re early on a breaking pitch, so you have to slow down in order to avoid whiffing; maybe the pitch is high and your swing is geared for lower pitches; maybe a changeup dropped more than you expected, so you have to lower your bat angle at the last second; and so on; and so on – the more bat speed you’re going to surrender.
Something changed a few days from the end of the year, for Carlos Correa. Well, something changed back. Correa has been excellent all season, but he was even better after his return from the IL on Sept. 14. He ran a 172 wRC+ over the final fortnight, up from 153 before the injury, and his on-base percentage was a gaudy .460. Now, we’re talking about just 11 games and 50 plate appearances, and Correa ran an unsustainable ..387 BABIP over that period. However, I think there were some real changes going on--temporary changes, but real ones, nonetheless. When Correa returned from a two-month absence due to plantar fasciitis in his right foot, I checked in on his bat speed and noticed that it wasn’t far below his season average. However, I spoke too soon. The really useful thing about bat speed is that it stabilizes very quickly. You only need to see a player reach a bat speed of 88 mph one time to know that they’re capable of hitting the ball extremely hard. Correa’s bat speed before the injury was 74.7 mph, which put him in the 85th percentile. After his return, his bat speed has averaged 72.8 mph, which would drop him down to the 65th percentile. Before the injury, 48% of his swings were over 75 mph; when he came back, it was 28%. Watching Correa swing the bat these past two weeks, I don’t think the issue is that he can’t put everything into his swing. He hit the ball hard often enough, and his swing looked explosive at times. Back in May, Matt Trueblood noticed that Correa had started using a scissor kick, transferring his weight so aggressively that his right foot would slide backward, away from home plate, sometimes rising off the ground entirely. Correa is still using that move. Here he is doing so on Wednesday night. However, Correa still didn’t approach the highest bat speed that he’s capable of. While he was still scissoring, his back foot was rarely leaving the ground entirely. Correa’s hardest swing of the season was measured at 87 mph, and he’s had 50 that were measured at or above 80 mph this season. In September, however, the fastest swing he unleashed was 79.2 mph. It ranks as just his 72nd-hardest swing of the season. In fact, of his 100 hardest swings this season, just four came after his return. Statistically speaking, if nothing had changed at all, we would expect that number to be closer to 12. However, at this point, I need to remind you of how Statcast measures bat speed. The number you see indicates how fast the barrel is moving in the video frame where it’s closest to the ball, and many, many factors influence it. For example, because the bat keeps accelerating all the way through the hitting zone, pulled balls, which are necessarily hit out in front, will have a higher bat speed than balls hit the other way, which are usually caught deeper in the zone. The overarching theme of these factors is adjustments. When you're exactly on time and the ball is put right where you want it, you can get off the fastest swing of your life. The more you have to adjust your swing – maybe you’re late on a fastball, so you have to cheat to catch up to it; maybe you’re early on a breaking pitch, so you have to slow down in order to avoid whiffing; maybe the pitch is high and your swing is geared for lower pitches; maybe a changeup dropped more than you expected, so you have to lower your bat angle at the last second; and so on; and so on – the more bat speed you’re going to surrender. -
Since his return from the IL, Carlos Correa had been trying out a new approach at the plate. Then he exploded. Something changed last night for Carlos Correa. Well, something changed back. Correa has been excellent all season, but he’s been even better since his return from the IL on September 14. He’s running a 187 wRC+, up from 153 before the injury, and his on-base percentage is approaching .500. Now, we’re talking about just 10 games and 46 plate appearances, and Correa is running an unsustainable .429 BABIP over that period. However, I think there might be some real changes going on; temporary changes, but real ones nonetheless. When Correa returned last week from a two-month absence due to plantar fasciitis in his right foot, I checked in on his bat speed and noticed that it wasn’t too far below his season average. However, I spoke too soon. The really useful thing about bat speed is that it stabilizes very quickly. You only need to see a player reach a bat speed of 88 mph one time to know that they’re capable of hitting the ball extremely hard. Correa’s bat speed before the injury was 74.7 mph, which put him in the 85th percentile. Since his return, his bat speed has averaged 72.8 mph, which would drop him down to the 65th percentile. Before the injury, 48% of his swings were over 75 mph; since he came back, it’s 28%. Watching Correa swing the bat these past two weeks, I don’t think the issue is that he can’t put everything into his swing. He’s hit the ball hard often enough, and his swing has looked explosive at times. Back in May, Matt Trueblood noticed that Correa had started using a scissor kick, transferring his weight so aggressively that his right foot would slide backwards away from home plate, sometimes rising off the ground entirely. Correa is still using that move. Here he is doing so on Wednesday night. <iframe src="https://sporty-clips.mlb.com/OVpCM0FfWGw0TUFRPT1fQjFOV1VBWUJWMWNBQ0ZRRUF3QUFDQUpTQUFOUlZGY0FWZ2NHVlFRREJ3dFZCd0pW.mp4" width="560" height="315"></iframe> However, Correa still hasn’t approached the highest bat speed that he’s capable of. While he’s still scissoring, his back foot is rarely leaving the ground entirely. Correa’s hardest swing of the season was measured at 87 mph, and he’s had 50 that were measured at or above 80 mph this season. Since his return, however, the fastest swing he’s unleashed was 79.2 mph. It ranks as just his 72nd-hardest swing of the season. In fact, of his 100 hardest swings this season, just four have come since his return. Statistically speaking, if nothing had changed at all, we would expect that number to be closer to 12. However, at this point, I need to remind you of how Statcast measures bat speed. The number you see indicates how fast the barrel is moving in the video frame where it’s closest to the ball, and many, many factors influence it. For example, because the bat keeps accelerating all the way through the hitting zone, pulled balls, which are necessarily hit out in front, will have a higher bat speed than balls hit the other way, which are usually caught deeper in the zone. The overarching theme of these factors is adjustments. When you're exactly on time and the ball is put right where you want it, you can get off the fastest swing of your life. The more you have to adjust your swing – maybe you’re late on a fastball so you have to cheat to catch up to it; maybe you’re early on a breaking pitch so you have to slow down in order to avoid whiffing; maybe the pitch is high and your swing is geared for lower pitches; maybe a changeup dropped more than you expected, so you have to lower your bat angle at the last second; and so on; and so on – the more bat speed you’re going to surrender. Players with superhuman bat speed, like Giancarlo Stanton, swing from their heels no matter what, and things go great when they manage to connect with the ball. Players with the slowest bat speed, like Luis Arraez, use the shortest, quickest swing possible and use the extra time and more direct bat path to give themselves a better chance of squaring the ball up. This is just a hunch based on watching his swings over these past two weeks, but I think Correa has been doing something slightly different lately. I think Correa hasn’t felt like he was completely ready to let it rip, and he’s been attempting his own version of the Arraez method. The graph below shows Correa’s 10-game rolling hard-hit rate, courtesy of FanGraphs. However, this isn’t hard-hit rate as Statcast measures it, with a cutoff at 95 mph. This chart uses data from Sports Info Solutions, which categorizes batted balls as soft, medium, or hard, using its own proprietary criteria. According to Statcast, Correa has a 30% hard-hit rate over his last 10 games. That’s on the low side for him, but not at all out of the norm. However, look at what SIS is seeing. The last 10 games are all the way on the right. Correa is all the way down near 12%. According to SIS, this is the lowest 10-game hard-hit rate of Correa’s entire career! Clearly Correa is hitting the ball hard enough to impress Statcast, but not hard enough to impress SIS. The problem isn’t that he’s mis-hitting the ball and making tons of soft contact. His soft contact rate is pretty low too, so the process of elimination tells us that Correa must be making lots of medium contact, and SIS agrees wholeheartedly. Once again, you're looking for the far right of the graph. Correa is all the way up near 75%, very nearly at a career-high in medium contact. He’s trading the extremely loud contact that he’s normally capable of for a whole bunch of almost-hard contact. He’s not going full Arraez – in fact, he’s chasing more, so his contact rate and squared-up rate are both down – but he is pulling the ball less often and hitting more line drives. When he does put the ball in play, he seems less focused on blowing it to smithereens. Sometimes he seems focused on hitting it where it’s pitched, and other times he seems like he’s really trying to direct the ball to a gap in the defense, which would help explain why his BABIP has been so unbelievably high. Here are three recent swings where he’s found a way to shoot the ball through the right side of the infield, even if it means a very awkward swing, because that’s what the defense was giving him. <iframe src="https://streamable.com/mlbfilmroom/00u836p5h9trnqKaW356/correa-going-the-other-way?partnerId=web_multimedia-search_video-share" width="560" height="315"></iframe> So that’s what I wanted to show you, but I mentioned a thousand words ago that these changes were temporary. Sometimes all it takes is one swing to make you feel like you’re back, and did Correa ever get that one swing last night. Here’s the monster home run he hit. <iframe src="https://sporty-clips.mlb.com/S3d2NjRfWGw0TUFRPT1fVUFSU1VWZFhBQUlBRGdkUVZ3QUFDRklEQUZoUVZRTUFVUUVDVTFaUVVnQlJDVkZl.mp4" width="560" height="315"></iframe> The soft-tossing Valente Bellozo hung an elevated sweeper right down the middle, and Correa got every bit of it. Unfortunately, Statcast didn’t get a bat speed reading on that swing, but I think it's safe to say that it was in the neighborhood of 150 mph. If you were watching the game, you might have noticed that Correa looked a little bit different after the home run. Even though the game went to extra innings, where the zombie runner on second made it an excellent time to simply punch the ball through the right side of the infield, Correa seemed to be feeling himself. He was swinging from his shoes again rather than looking to place the ball or staying back and hitting it where it was pitched. <iframe src="https://sporty-clips.mlb.com/S3d2NjRfWGw0TUFRPT1fVXdkVVVRRURBMWNBV1ZJTFVBQUFVZ1JUQUZrR0JRSUFWbDFUVWxWVEJRSlRBRmRl.mp4" width="560" height="315"></iframe> I’ll be really curious to see what Corera’s swing looks like over the final three games of the season. Did that homer give him the confidence to unleash his A swing? If the team is mathematically eliminated, will he go back to the bench because he’s not 100% after all? However, I doubt these last couple weeks will have much bearing on Correa over the long-term. He’s got a powerful bat, and while he’s had been great since his return, he's also been a bit lucky; there’s no question that the Twins will want him to keep blasting home runs when he’s back to full strength next season. Still, it’s been really fun to watch him succeed with a new approach, and the ability to do so speaks volumes about his skill as a hitter. View full article
-
The Twins resisted the temptation to rush their two biggest stars back from injury. So far, they've been rewarded for their patience. Image courtesy of © Ken Blaze-Imagn Images Since returning from a two-month absence due to plantar fasciitis, Carlos Correa has only played in four games, one of them as a designated hitter. In those four games, though, he has looked comfortable. He’s coming off a three-hit game on Wednesday and a two-walk game on Thursday. In that tiny four-game sample, he’s running a 1.068 OPS. Byron Buxton has been back for five games himself, after missing a month due to a hip issue. Despite a rough game on Wednesday, he’s also looked like solid since his return, running an .833 OPS and contributing defensively. Just to be clear, these sample sizes are so small as to be meaningless. What’s not meaningless is the fact that both players have, by all appearances, returned ready to play at something like full strength. Both in the field and at the plate, they look like themselves, rather than hobbled shadows of their former glory. Both players have seen their average bat speed drop by less than a single mile per hour since their return. In other words, they’re not taking weak cuts because they can’t put their whole body into a swing. They’re able to swing the bat hard and hit the ball hard. They haven’t shown any evidence of defensive limitations, either. We’re talking about superstars, and there is no question that the Twins missed them dearly as they watched their chances--first of winning a division title, and now of securing the final Wild Card spot--dwindle. I don’t know what will happen over the next week, and if the team doesn't recover from its current collapse and misses out on the playoffs, these two absences will loom very large in any postmortem we write about their season. However, I honestly don’t think the Twins could have handled these situations any better than they did. Keep in mind what Correa and Buxton contributed while playing through injuries in 2023. Correa put up a 95 wRC+ and 1.8 WAR while gutting it out through plantar fasciitis. Both numbers were the second-worst of his career (trailing only the short 2020 season), and they added up to a season that was a bit below average. Buxton didn’t play in the field all year, and in August, a hamstring strain finally knocked him out for the rest of the regular season. In all, he limped to a 97 wRC+ and 0.6 WAR. Once again, that’s a bit below average, but it’s devastatingly low for a designated hitter, and both numbers were the lowest Buxton had put up since 2018. We’ll never know what would have happened had the Twins encouraged Buxton and Correa to fight through their respective injuries and play every day this season, but it’s hard to imagine that they would have performed any better than they did in 2023, and they almost certainly would have put themselves in greater danger of injuring themselves further. Whether or not Correa and Buxton keep performing well, it just made sense to resist the temptation to rush them back. It gave them the best chance of getting and staying healthy in the long run, and it gave the team the best chance of seeing them play at a high level when it counts the most. Before the season, the Twins said that they were hoping to get 100 games out of Buxton in center field. They won’t be far off that goal, as he’s now played in 87 and started 80 contests. Although Manuel Margot hasn’t put up the season they hoped, he’s a solid center fielder, and he was brought in for the express purpose of acting as, essentially, a second starting center fielder. The Twins built a deep team and relied on prospect depth to fill in the gaps, and now, their two biggest stars have returned and hit the ground running in time for the stretch run. Willi Castro has emerged as a star in his own right, and he’s put up excellent defensive numbers while filling in at shortstop. We may not love the idea of shifting Royce Lewis over to second base in order to make room for José Miranda at third, but it’s important to keep in mind that (unpalatable though it may be), the idea is an answer to the best possible question a team can have: How do we make room in our lineup for all these great hitters? Letting Correa and Buxton (not to mention Lewis) get fully healthy didn’t just allow the Twins to get their best players back when it mattered the most; it also allowed them to keep their role players and bench players engaged and ready to play. Christian Vázquez has looked like a completely different hitter during the second half, and Kyle Farmer has exploded, running a 230 wRC+ since Aug. 26. All of a sudden, this lineup doesn’t have any holes, and because even the bench players have been getting steady playing time, there aren’t many holes there, either. By being unafraid to use fill-ins, the Twins have assembled an all-killer, no-filler lineup. Just two Twins, Castro and Carlos Santana, will qualify for a batting title this season. But the team has nine different players – and if you’re keeping score at home, that’s how many you get to put in your lineup – who have run a wRC+ above 110 while making at least 240 plate appearances. That’s the most in baseball. The only other teams with seven such players are the Dodgers, Red Sox, and Mets. Minnesota may not have Aaron Judge and Juan Soto, but you could argue that there isn’t a lineup in baseball that’s tougher from top to bottom. None of this matters if the Twins end up missing the playoffs, but if they don't, they'll be glad that their stars are as close to 100% as they can get them. View full article
-
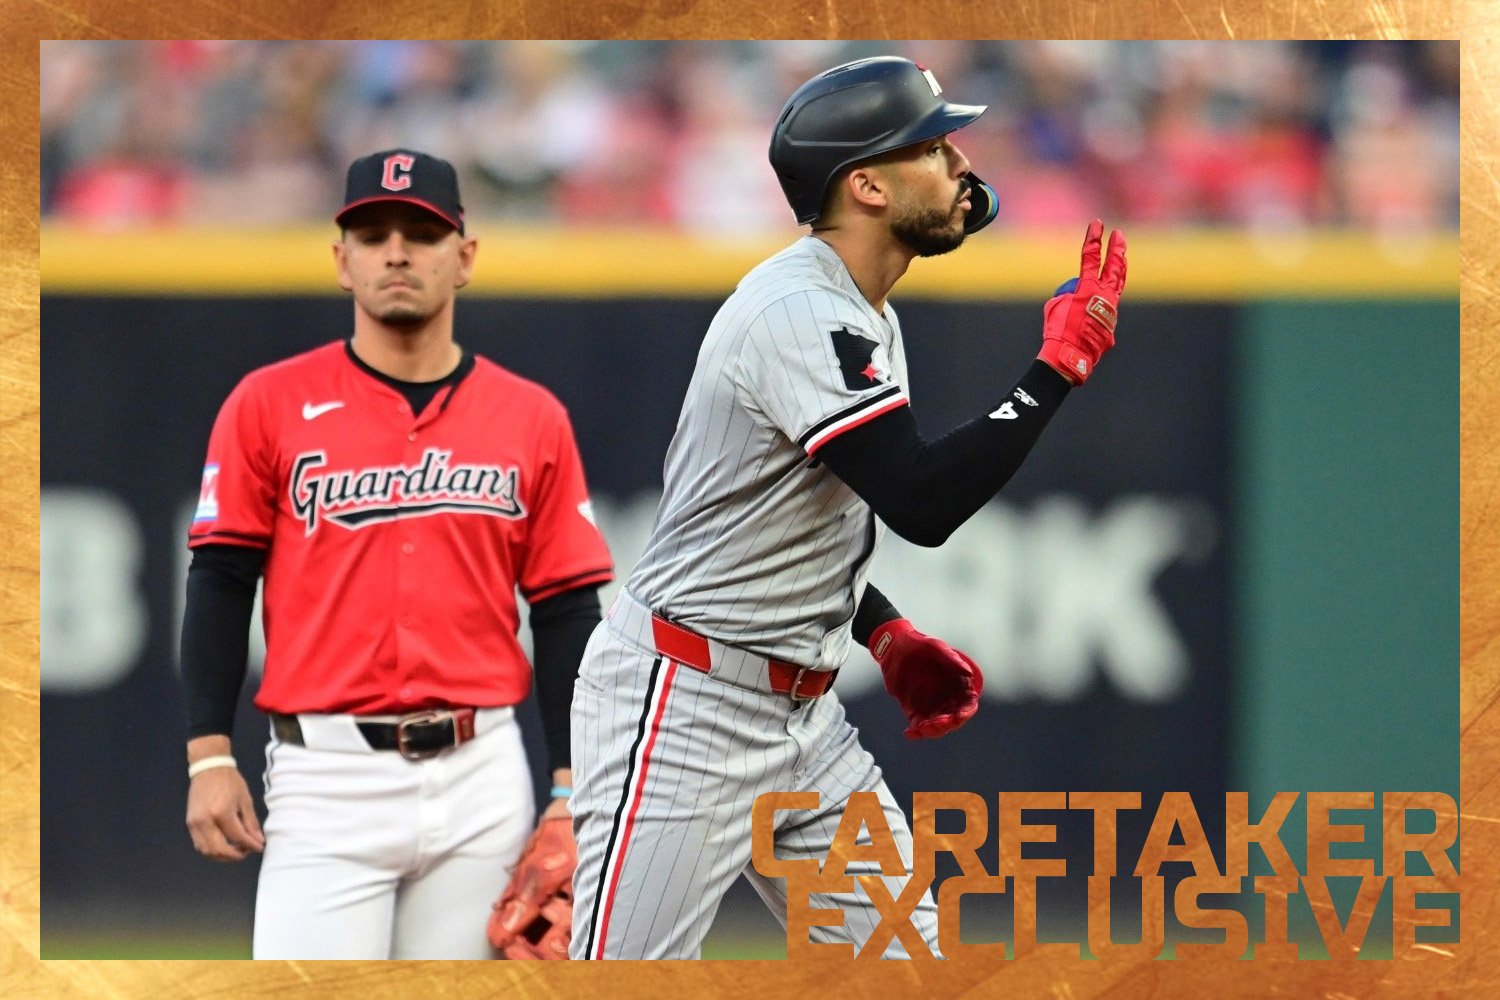 Since returning from a two-month absence due to plantar fasciitis, Carlos Correa has only played in four games, one of them as a designated hitter. In those four games, though, he has looked comfortable. He’s coming off a three-hit game on Wednesday and a two-walk game on Thursday. In that tiny four-game sample, he’s running a 1.068 OPS. Byron Buxton has been back for five games himself, after missing a month due to a hip issue. Despite a rough game on Wednesday, he’s also looked like solid since his return, running an .833 OPS and contributing defensively. Just to be clear, these sample sizes are so small as to be meaningless. What’s not meaningless is the fact that both players have, by all appearances, returned ready to play at something like full strength. Both in the field and at the plate, they look like themselves, rather than hobbled shadows of their former glory. Both players have seen their average bat speed drop by less than a single mile per hour since their return. In other words, they’re not taking weak cuts because they can’t put their whole body into a swing. They’re able to swing the bat hard and hit the ball hard. They haven’t shown any evidence of defensive limitations, either. We’re talking about superstars, and there is no question that the Twins missed them dearly as they watched their chances--first of winning a division title, and now of securing the final Wild Card spot--dwindle. I don’t know what will happen over the next week, and if the team doesn't recover from its current collapse and misses out on the playoffs, these two absences will loom very large in any postmortem we write about their season. However, I honestly don’t think the Twins could have handled these situations any better than they did. Keep in mind what Correa and Buxton contributed while playing through injuries in 2023. Correa put up a 95 wRC+ and 1.8 WAR while gutting it out through plantar fasciitis. Both numbers were the second-worst of his career (trailing only the short 2020 season), and they added up to a season that was a bit below average. Buxton didn’t play in the field all year, and in August, a hamstring strain finally knocked him out for the rest of the regular season. In all, he limped to a 97 wRC+ and 0.6 WAR. Once again, that’s a bit below average, but it’s devastatingly low for a designated hitter, and both numbers were the lowest Buxton had put up since 2018. We’ll never know what would have happened had the Twins encouraged Buxton and Correa to fight through their respective injuries and play every day this season, but it’s hard to imagine that they would have performed any better than they did in 2023, and they almost certainly would have put themselves in greater danger of injuring themselves further. Whether or not Correa and Buxton keep performing well, it just made sense to resist the temptation to rush them back. It gave them the best chance of getting and staying healthy in the long run, and it gave the team the best chance of seeing them play at a high level when it counts the most. Before the season, the Twins said that they were hoping to get 100 games out of Buxton in center field. They won’t be far off that goal, as he’s now played in 87 and started 80 contests. Although Manuel Margot hasn’t put up the season they hoped, he’s a solid center fielder, and he was brought in for the express purpose of acting as, essentially, a second starting center fielder. The Twins built a deep team and relied on prospect depth to fill in the gaps, and now, their two biggest stars have returned and hit the ground running in time for the stretch run. Willi Castro has emerged as a star in his own right, and he’s put up excellent defensive numbers while filling in at shortstop. We may not love the idea of shifting Royce Lewis over to second base in order to make room for José Miranda at third, but it’s important to keep in mind that (unpalatable though it may be), the idea is an answer to the best possible question a team can have: How do we make room in our lineup for all these great hitters? Letting Correa and Buxton (not to mention Lewis) get fully healthy didn’t just allow the Twins to get their best players back when it mattered the most; it also allowed them to keep their role players and bench players engaged and ready to play. Christian Vázquez has looked like a completely different hitter during the second half, and Kyle Farmer has exploded, running a 230 wRC+ since Aug. 26. All of a sudden, this lineup doesn’t have any holes, and because even the bench players have been getting steady playing time, there aren’t many holes there, either. By being unafraid to use fill-ins, the Twins have assembled an all-killer, no-filler lineup. Just two Twins, Castro and Carlos Santana, will qualify for a batting title this season. But the team has nine different players – and if you’re keeping score at home, that’s how many you get to put in your lineup – who have run a wRC+ above 110 while making at least 240 plate appearances. That’s the most in baseball. The only other teams with seven such players are the Dodgers, Red Sox, and Mets. Minnesota may not have Aaron Judge and Juan Soto, but you could argue that there isn’t a lineup in baseball that’s tougher from top to bottom. None of this matters if the Twins end up missing the playoffs, but if they don't, they'll be glad that their stars are as close to 100% as they can get them.
 -
Pablo López Is Throwing Hitters a Curveball. It's His Curveball.
Davy Andrews posted an article in Caretakers
.png.95acfcd1428d8f74124952ed786c1000.png) I don’t need to tell you that Pablo López is back on top. He’s won his last four starts and his last five decisions. Over his last 16 starts, he’s 10-2 with a 2.75 ERA, while striking out more than a batter per inning. A couple weeks ago, John Foley detailed several things that have gone differently lately: First, López stopped being quite so unlucky. Second, he made some mechanical adjustments, including shortening up his stride. Presumably because of those adjustments, López’s four-seam fastball ticked up in velocity and gained an inch of rise. López also got much better about throwing the pitch up at or above the top of the zone, where all that ride makes it most effective. Lastly, López started relying on the four-seamer more often. After throwing it roughly 40% of the time in June and July, it was at nearly 47% in August (though that percentage has ticked back down in his last couple of starts). John is very smart, and he was right to focus on the four-seamer. It’s been López’s bread and butter all season. According to Statcast’s run values, it has been worth 23 runs, making it the second-most valuable pitch in all of baseball (trailing only Cade Smith’s four-seamer). Today, however, I’d like to focus on López’s curveball. He’s throwing it about 10% of the time this season, which ranks fourth among his five pitches, narrowly ahead of his sinker. There’s a good reason for that: According to Stuff+, the pitch has been declining in quality for years now. Here’s how it rated in each season, starting in 2020: 114 103 98 93 84 That’s not the trajectory you’re looking for as a pitcher. In 2020, the curve’s 114 mark made it the best-rated pitch in López’s arsenal, but this year’s 84 makes it his worst. Here's the thing, though: I lied just a little bit about that 84 figure. The pitch did rate an 84 this season, but only through Aug. 12. Over the five starts from Aug. 18 to Sept 10, Stuff+ has the pitch at a fantastic 130. Now, this is a very short sample size — we’re only talking about 42 pitches — but that’s still an enormous jump. In case you’re not familiar with Stuff+, it’s a model that looks at the physical characteristics of a pitch and predicts how well it will perform. So let’s look at how the pitch has changed. Date Curves MPH H-Break V-Break Before Aug. 18 233 82.1 6.5" -9.9" Since August 16 42 83.5 6.7" -12.3"
I don’t need to tell you that Pablo López is back on top. He’s won his last four starts and his last five decisions. Over his last 16 starts, he’s 10-2 with a 2.75 ERA, while striking out more than a batter per inning. A couple weeks ago, John Foley detailed several things that have gone differently lately: First, López stopped being quite so unlucky. Second, he made some mechanical adjustments, including shortening up his stride. Presumably because of those adjustments, López’s four-seam fastball ticked up in velocity and gained an inch of rise. López also got much better about throwing the pitch up at or above the top of the zone, where all that ride makes it most effective. Lastly, López started relying on the four-seamer more often. After throwing it roughly 40% of the time in June and July, it was at nearly 47% in August (though that percentage has ticked back down in his last couple of starts). John is very smart, and he was right to focus on the four-seamer. It’s been López’s bread and butter all season. According to Statcast’s run values, it has been worth 23 runs, making it the second-most valuable pitch in all of baseball (trailing only Cade Smith’s four-seamer). Today, however, I’d like to focus on López’s curveball. He’s throwing it about 10% of the time this season, which ranks fourth among his five pitches, narrowly ahead of his sinker. There’s a good reason for that: According to Stuff+, the pitch has been declining in quality for years now. Here’s how it rated in each season, starting in 2020: 114 103 98 93 84 That’s not the trajectory you’re looking for as a pitcher. In 2020, the curve’s 114 mark made it the best-rated pitch in López’s arsenal, but this year’s 84 makes it his worst. Here's the thing, though: I lied just a little bit about that 84 figure. The pitch did rate an 84 this season, but only through Aug. 12. Over the five starts from Aug. 18 to Sept 10, Stuff+ has the pitch at a fantastic 130. Now, this is a very short sample size — we’re only talking about 42 pitches — but that’s still an enormous jump. In case you’re not familiar with Stuff+, it’s a model that looks at the physical characteristics of a pitch and predicts how well it will perform. So let’s look at how the pitch has changed. Date Curves MPH H-Break V-Break Before Aug. 18 233 82.1 6.5" -9.9" Since August 16 42 83.5 6.7" -12.3" -
As he's surged in the past month, the ace's oft-overlooked curveball has turned into a deadly weapon. It might be time for him to start using it more. Image courtesy of © Nathan Ray Seebeck-USA TODAY Sports I don’t need to tell you that Pablo López is back on top. He’s won his last four starts and his last five decisions. Over his last 16 starts, he’s 10-2 with a 2.75 ERA, while striking out more than a batter per inning. A couple weeks ago, John Foley detailed several things that have gone differently lately: First, López stopped being quite so unlucky. Second, he made some mechanical adjustments, including shortening up his stride. Presumably because of those adjustments, López’s four-seam fastball ticked up in velocity and gained an inch of rise. López also got much better about throwing the pitch up at or above the top of the zone, where all that ride makes it most effective. Lastly, López started relying on the four-seamer more often. After throwing it roughly 40% of the time in June and July, it was at nearly 47% in August (though that percentage has ticked back down in his last couple of starts). John is very smart, and he was right to focus on the four-seamer. It’s been López’s bread and butter all season. According to Statcast’s run values, it has been worth 23 runs, making it the second-most valuable pitch in all of baseball (trailing only Cade Smith’s four-seamer). Today, however, I’d like to focus on López’s curveball. He’s throwing it about 10% of the time this season, which ranks fourth among his five pitches, narrowly ahead of his sinker. There’s a good reason for that: According to Stuff+, the pitch has been declining in quality for years now. Here’s how it rated in each season, starting in 2020: 114 103 98 93 84 That’s not the trajectory you’re looking for as a pitcher. In 2020, the curve’s 114 mark made it the best-rated pitch in López’s arsenal, but this year’s 84 makes it his worst. Here's the thing, though: I lied just a little bit about that 84 figure. The pitch did rate an 84 this season, but only through Aug. 12. Over the five starts from Aug. 18 to Sept 10, Stuff+ has the pitch at a fantastic 130. Now, this is a very short sample size — we’re only talking about 42 pitches — but that’s still an enormous jump. In case you’re not familiar with Stuff+, it’s a model that looks at the physical characteristics of a pitch and predicts how well it will perform. So let’s look at how the pitch has changed. Date Curves MPH H-Break V-Break Before Aug. 18 233 82.1 6.5" -9.9" Since August 16 42 83.5 6.7" -12.3" View full article
-
We're not saying the Twins' young slugger is Paul Bunyan in disguise. But if he were, how would things be different, really? Image courtesy of © Jerome Miron-USA TODAY Sports I’m excited about Matt Wallner. You’re excited about Matt Wallner. Everybody’s excited about Matt Wallner. Since his return to Minnesota on Jul. 7, he’s running a 191 wRC+, which means that he’s been almost twice as productive at the plate as the average batter. Over that stretch, the only players who have hit better than Wallner are Aaron Judge, Bobby Witt Jr., and Vladimir Guerrero Jr. That’s some good company. The Forest Lake native is very much a one-weird-trick kind of hitter, and that trick is interrogating the structural integrity of a baseball. Since his callup, he ranks first in hard-hit rate, first in barrel rate, second in average exit velocity, and sixth in average bat speed. Wallner is a big, strong man who takes big, strong swings, and the ball jumps off his bat like it’s a sentient being whose sole desire is to get as far away from him as possible. We’re going to take a closer look at Wallner’s unbelievable summer and what we should expect going forward. Let’s start with past performance. If you combine the last three years, Wallner now has just a bit under a full season’s worth of playing time at the big-league level. Over that stretch, he’s slashing .250/.368/.512, with 26 homers, good for a wRC+ of 147. Want to hear something strange? Wallner has had eight different stops in the minors, and while he was always an above-average hitter, he only ran a wRC+ of 150 or better in one of them. That’s not usually how things work. Most hitters don’t breathe a sigh of relief when they go from facing Triple-A pitching to big-league pitching. Even after his incredible run in the big leagues last year, it would have been completely unreasonable to expect Wallner to do what he’s doing now. What he’s doing now is completely unreasonable! He’s running a near-.400 BABIP, the highest in baseball, a sign of unsustainability if ever there was one. While his current performance should absolutely change our idea of Wallner’s ceiling, we should expect him to come down to Earth. It’s just going to take some time to find out exactly where his performance will settle. One thing that I find both fun and encouraging is that pitchers are already scared of Wallner. You know the standard adjustment dance when a rookie comes up: Pitchers pound them with fastballs, and then once they prove that they can hit the fastball, the league starts attacking them with bendy stuff. If they prove that they can lay off the bendy stuff, then pitchers have to formulate a more nuanced plan of attack. If you were worried that Wallner is just succeeding because his up-and-down journey over the last couple years left him unfamiliar to big-league pitchers, who in turn just challenged him with fastballs, don’t be. Wallner has already passed that phase. So far this season, 44% of the pitches he’s has seen this season have been fastballs. Of the 400 players who have seen at least 500 pitches this season, that puts him in the 19th percentile. Likewise, his 47% zone rate puts him in the 11th percentile, and if you look just at the heart of the plate, he’s in the 9th percentile. Pitchers don’t want to throw him fastballs, and they’d rather hope that Wallner chases a bad pitch than attack him in the strike zone. (Yes, I realize that I should have written a whole article just about his zone rate, so that I could've titled it "Balls to the Wallner"). The good news is that (although he’s chasing more than he did in his previous stints with the Twins) Wallner isn’t biting. He’s running a better-than-average chase rate, while still being aggressive when he gets a pitch that he can drive. View full article
-
The Incredible, Extreme Present and Inscrutable Future of Matt Wallner
Davy Andrews posted an article in Caretakers
.png.8d7f1bdb75c189a46e93a2b0edd9859a.png) I’m excited about Matt Wallner. You’re excited about Matt Wallner. Everybody’s excited about Matt Wallner. Since his return to Minnesota on Jul. 7, he’s running a 191 wRC+, which means that he’s been almost twice as productive at the plate as the average batter. Over that stretch, the only players who have hit better than Wallner are Aaron Judge, Bobby Witt Jr., and Vladimir Guerrero Jr. That’s some good company. The Forest Lake native is very much a one-weird-trick kind of hitter, and that trick is interrogating the structural integrity of a baseball. Since his callup, he ranks first in hard-hit rate, first in barrel rate, second in average exit velocity, and sixth in average bat speed. Wallner is a big, strong man who takes big, strong swings, and the ball jumps off his bat like it’s a sentient being whose sole desire is to get as far away from him as possible. We’re going to take a closer look at Wallner’s unbelievable summer and what we should expect going forward. Let’s start with past performance. If you combine the last three years, Wallner now has just a bit under a full season’s worth of playing time at the big-league level. Over that stretch, he’s slashing .250/.368/.512, with 26 homers, good for a wRC+ of 147. Want to hear something strange? Wallner has had eight different stops in the minors, and while he was always an above-average hitter, he only ran a wRC+ of 150 or better in one of them. That’s not usually how things work. Most hitters don’t breathe a sigh of relief when they go from facing Triple-A pitching to big-league pitching. Even after his incredible run in the big leagues last year, it would have been completely unreasonable to expect Wallner to do what he’s doing now. What he’s doing now is completely unreasonable! He’s running a near-.400 BABIP, the highest in baseball, a sign of unsustainability if ever there was one. While his current performance should absolutely change our idea of Wallner’s ceiling, we should expect him to come down to Earth. It’s just going to take some time to find out exactly where his performance will settle. One thing that I find both fun and encouraging is that pitchers are already scared of Wallner. You know the standard adjustment dance when a rookie comes up: Pitchers pound them with fastballs, and then once they prove that they can hit the fastball, the league starts attacking them with bendy stuff. If they prove that they can lay off the bendy stuff, then pitchers have to formulate a more nuanced plan of attack. If you were worried that Wallner is just succeeding because his up-and-down journey over the last couple years left him unfamiliar to big-league pitchers, who in turn just challenged him with fastballs, don’t be. Wallner has already passed that phase. So far this season, 44% of the pitches he’s has seen this season have been fastballs. Of the 400 players who have seen at least 500 pitches this season, that puts him in the 19th percentile. Likewise, his 47% zone rate puts him in the 11th percentile, and if you look just at the heart of the plate, he’s in the 9th percentile. Pitchers don’t want to throw him fastballs, and they’d rather hope that Wallner chases a bad pitch than attack him in the strike zone. (Yes, I realize that I should have written a whole article just about his zone rate, so that I could've titled it "Balls to the Wallner"). The good news is that (although he’s chasing more than he did in his previous stints with the Twins) Wallner isn’t biting. He’s running a better-than-average chase rate, while still being aggressive when he gets a pitch that he can drive.
I’m excited about Matt Wallner. You’re excited about Matt Wallner. Everybody’s excited about Matt Wallner. Since his return to Minnesota on Jul. 7, he’s running a 191 wRC+, which means that he’s been almost twice as productive at the plate as the average batter. Over that stretch, the only players who have hit better than Wallner are Aaron Judge, Bobby Witt Jr., and Vladimir Guerrero Jr. That’s some good company. The Forest Lake native is very much a one-weird-trick kind of hitter, and that trick is interrogating the structural integrity of a baseball. Since his callup, he ranks first in hard-hit rate, first in barrel rate, second in average exit velocity, and sixth in average bat speed. Wallner is a big, strong man who takes big, strong swings, and the ball jumps off his bat like it’s a sentient being whose sole desire is to get as far away from him as possible. We’re going to take a closer look at Wallner’s unbelievable summer and what we should expect going forward. Let’s start with past performance. If you combine the last three years, Wallner now has just a bit under a full season’s worth of playing time at the big-league level. Over that stretch, he’s slashing .250/.368/.512, with 26 homers, good for a wRC+ of 147. Want to hear something strange? Wallner has had eight different stops in the minors, and while he was always an above-average hitter, he only ran a wRC+ of 150 or better in one of them. That’s not usually how things work. Most hitters don’t breathe a sigh of relief when they go from facing Triple-A pitching to big-league pitching. Even after his incredible run in the big leagues last year, it would have been completely unreasonable to expect Wallner to do what he’s doing now. What he’s doing now is completely unreasonable! He’s running a near-.400 BABIP, the highest in baseball, a sign of unsustainability if ever there was one. While his current performance should absolutely change our idea of Wallner’s ceiling, we should expect him to come down to Earth. It’s just going to take some time to find out exactly where his performance will settle. One thing that I find both fun and encouraging is that pitchers are already scared of Wallner. You know the standard adjustment dance when a rookie comes up: Pitchers pound them with fastballs, and then once they prove that they can hit the fastball, the league starts attacking them with bendy stuff. If they prove that they can lay off the bendy stuff, then pitchers have to formulate a more nuanced plan of attack. If you were worried that Wallner is just succeeding because his up-and-down journey over the last couple years left him unfamiliar to big-league pitchers, who in turn just challenged him with fastballs, don’t be. Wallner has already passed that phase. So far this season, 44% of the pitches he’s has seen this season have been fastballs. Of the 400 players who have seen at least 500 pitches this season, that puts him in the 19th percentile. Likewise, his 47% zone rate puts him in the 11th percentile, and if you look just at the heart of the plate, he’s in the 9th percentile. Pitchers don’t want to throw him fastballs, and they’d rather hope that Wallner chases a bad pitch than attack him in the strike zone. (Yes, I realize that I should have written a whole article just about his zone rate, so that I could've titled it "Balls to the Wallner"). The good news is that (although he’s chasing more than he did in his previous stints with the Twins) Wallner isn’t biting. He’s running a better-than-average chase rate, while still being aggressive when he gets a pitch that he can drive. -
.png.92ef2e5e18844785b41bc781216a6c2d.png) Last season, the Twins set an all-time record by striking out 1,654 times. On a percentage basis, their 26.6% strikeout rate was the sixth-highest in the history of the American and National Leagues. If you throw out the tiny sample size of the 2020 season, it trails only the 2021 Cubs, who bested the Twins by a measly tenth of a percentage point. Around this time last year, I wrote about their record pace. In particular, I noticed that nearly every player on the roster was striking out more than they had the previous season. I pulled the strikeout rate from every team in the FanGraphs database, and then compared it to their strikeout rate in the next season, so I can now tell you that from 2022 to 2023, the team’s strikeout rate jumped 4.5 percentage points, the 10th-biggest increase in the history of the American and National Leagues. However, all those strikeouts didn’t keep the Twins from performing well at the plate. Their 109 wRC+ made them the sixth-best offense in baseball. That was also the third-best mark in club history, trailing only 2019, when they ran a 116 wRC+, and 1976, when they put up a 111 mark. That’s where the Twins were last season: They had a great offense that also happened to be great at striking out. Just about a month ago, Nick Nelson filled us in on where the Twins are this season. They have turned things around dramatically in the strikeout department, running a 17.5% strikeout rate in the month of June, the second-lowest in baseball. Nick also broke down all the reasons behind the sudden turnaround: improvements by players like Trevor Larnach and Byron Buxton, along with replacing three-true-outcome mavens like Joey Gallo and Michael A. Taylor with contact-oriented players like Carlos Santana and Manuel Margot. Since Nick’s article, the Twins have regressed a bit, striking out 21% of the time in July. Yet, they have an even better offense than they did last year, running a 113 wRC+. They also have their lowest strikeout rate in five years at 21.0%, which is also 10th overall. Because Nick already did the hard work of breaking things down on the level of individual players, I’d like to take a look at the bigger picture. The bigger picture is fun because of some simple math. Here's how it works.
Last season, the Twins set an all-time record by striking out 1,654 times. On a percentage basis, their 26.6% strikeout rate was the sixth-highest in the history of the American and National Leagues. If you throw out the tiny sample size of the 2020 season, it trails only the 2021 Cubs, who bested the Twins by a measly tenth of a percentage point. Around this time last year, I wrote about their record pace. In particular, I noticed that nearly every player on the roster was striking out more than they had the previous season. I pulled the strikeout rate from every team in the FanGraphs database, and then compared it to their strikeout rate in the next season, so I can now tell you that from 2022 to 2023, the team’s strikeout rate jumped 4.5 percentage points, the 10th-biggest increase in the history of the American and National Leagues. However, all those strikeouts didn’t keep the Twins from performing well at the plate. Their 109 wRC+ made them the sixth-best offense in baseball. That was also the third-best mark in club history, trailing only 2019, when they ran a 116 wRC+, and 1976, when they put up a 111 mark. That’s where the Twins were last season: They had a great offense that also happened to be great at striking out. Just about a month ago, Nick Nelson filled us in on where the Twins are this season. They have turned things around dramatically in the strikeout department, running a 17.5% strikeout rate in the month of June, the second-lowest in baseball. Nick also broke down all the reasons behind the sudden turnaround: improvements by players like Trevor Larnach and Byron Buxton, along with replacing three-true-outcome mavens like Joey Gallo and Michael A. Taylor with contact-oriented players like Carlos Santana and Manuel Margot. Since Nick’s article, the Twins have regressed a bit, striking out 21% of the time in July. Yet, they have an even better offense than they did last year, running a 113 wRC+. They also have their lowest strikeout rate in five years at 21.0%, which is also 10th overall. Because Nick already did the hard work of breaking things down on the level of individual players, I’d like to take a look at the bigger picture. The bigger picture is fun because of some simple math. Here's how it works.

.png.e933f059ef1380560858da5e114928eb.png)


.png.95acfcd1428d8f74124952ed786c1000.png)
.png.8d7f1bdb75c189a46e93a2b0edd9859a.png)
.png.92ef2e5e18844785b41bc781216a6c2d.png)