



Teflon
-
Posts
982 -
Joined
-
Last visited
-
Days Won
2
Content Type
Profiles
News
Minnesota Twins Videos
2026 Minnesota Twins Top Prospects Ranking
2022 Minnesota Twins Draft Picks
Minnesota Twins Free Agent & Trade Rumors, Notes, & Tidbits
Guides & Resources
2023 Minnesota Twins Draft Picks
The Minnesota Twins Players Project
2024 Minnesota Twins Draft Picks
2025 Minnesota Twins Draft Pick Tracker
2026 Minnesota Twins Draft Tracker: Picks & Bonuses
Forums
Blogs
Events
Store
Downloads
Gallery
Everything posted by Teflon
-
 People need to look a pitchers like Deduno a little more closely and understand that the high walk rate which is such a flashing number in his pitching stats is not as negative an indicator as people would have you think given Deduno's low hit rate. Compare two pitchers with similar WHIPs and the pitcher with the higher walk rate will fare better because a walk only puts the batter on first base and only advances base runners in a force situations a single base while hits will result in more total bases for both batters and runners. Liam Hendriks (1.547) and Sam Deduno (1.544) had nearly identical WHIPs for the Twins last year but Hendriks' was based on 11.2 H/9 and 2.7 BB/9 while Sam's was from 7.9 H/9 and a 6.0 BB/9. Hendriks surrendered 184 total bases to batters versus only 112 for Deduno. This means that for the same number of batters put on base, Deduno gave up 65% fewer total bases. (And this doesn't even account for the extra bases by base runners.) In a similar number of innings pitched (85 for Hendriks, 79 for Deduno) Deduno gave up 21 fewer runs. I won't throw Liam's 1-8 mark in the argument because his run support was horrible (3.4 runs per game.) while Deduno's was decent at 5.1. (and, by the way, Diamond got 6.0. Care to guess what kind of pitcher Diamond will be in 2013 with, say, a run and a half fewer per game?)
-
Lots of good reports about Kyle Gibson...
Teflon replied to John Bonnes's topic in Minnesota Twins Talk
In a related note, the Twins announced they have become the first MLB team to convert to KPH on their JUGS guns. -
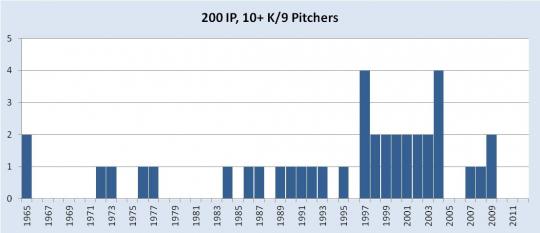
In the 1965 season, a threshold was passed on big league pitching mounds that had never been exceeded in the history of baseball up to that point. No pitcher throwing 200 innings or more - whether he be Bob Feller, Herb Score, Walter Johnson, or Rube Waddell - had ever struck out 10 or more batters per 9 innings. In 1965, both "Sudden" Sam McDowell and Sandy Koufax eclipsed that mark, ushering in a new era of strikeout proficiency in which the threshold would be surpassed 39 more times. What had changed from Feller's years to Koufax's? In the 1930's and 40's, the average pitcher making 30 or more starts in a season pitched around 255 innings and completed nearly 18 of the games he started. By the 1950's, he was throwing 10 fewer innings and completing about 3 fewer games. By 1965, the year of Koufax's and McDowell's accomplishments, the average pitcher was only completing about 10 games and throwing 238 innings. As the expectations for starting pitchers to go deep into games was lessening, pitchers were now able to hold less back, fostering an increasing trend of quality over quantity. In Koufax's case, this trend was not manifested in the innings he pitched in a season - as he threw a whopping 335.2 innings and completed 27 games in 1965 - but in the innings he pitched in a career, as he had to leave the game at age 30. In the 70's and 80's, Nolan Ryan would pitch 200+ innings and post K/9 rates over 10 seven times including an unbelievable 3 times at age 40 or older after having not done so since age 30. (And we think Roger Clemens was doping?) In the 1990's and 2000's, Randy Johnson would approach Ryan's numbers and surpass them, hitting the 10+ K rate ten times in his 22 professional seasons. Curt Schilling (4 times), Pedro Martinez (3) and Tim Lincecum (2) are the only pitchers to join Ryan and Johnson on this list multiple times. There are 13 one-timers on the list including the only Twins pitcher, Johan Santana, who did it in 2004. Here is the complete list: Randy Johnson (1991, 1992, 1993, 1995, 1997, 1999, 2000, 2001, 2002, 2004, 2007) Nolan Ryan (1972, 1973, 1976, 1977, 1987, 1989, 1990) Curt Schilling (1997, 1998, 2001, 2002) Pedro Martinez (1997, 1999, 2000) Tim Lincecum (2008, 2009) Roger Clemens 1998 Dwight Gooden 1984 Scott Kazmir 2007 Sandy Koufax 1965 Sam McDowell 1965 Hideo Nomo 1997 Mark Prior 2003 Johan Santana 2004 Jason Schmidt 2004 Mike Scott 1986 Ben Sheets 2004 Justin Verlander 2009 Kerry Wood 2003 Here is the breakdown in average innings pitched and complete games for pitchers with 30+ starts by decade: 1930s - 257 IP, 17.9 CG 1940s - 253 IP, 17.9 CG 1950s - 244 IP, 14.8 CG 1960s - 241 IP, 11.2 CG 1970s - 245 IP, 11.5 CG 1980s - 224 IP, 6.9 CG 1990s - 212 IP, 3.6 CG 2000s - 204 IP, 1.7 CG 2010s - 203 IP, 1.6 CG A breakdown of the number of 200 inning - 10 K/9 pitchers by year is shown below. I find it odd that there is such a aberation between the years of 1997 and 2004. While this total study comprises a very small sample (39 instances) it still seems odd that this period - which I equate to the peak steroid era - should appear and that years since have diminished to the point that no pitcher has passed this threshold for the last three seasons. The last period this long was in the early 80's. Conspiracy theorists - draw your own conclusions. Perhaps we are only seeing the end of one era and the beginning of another as teams move more and more to imposing inning restrictions and pitch counts on younger arms.
-
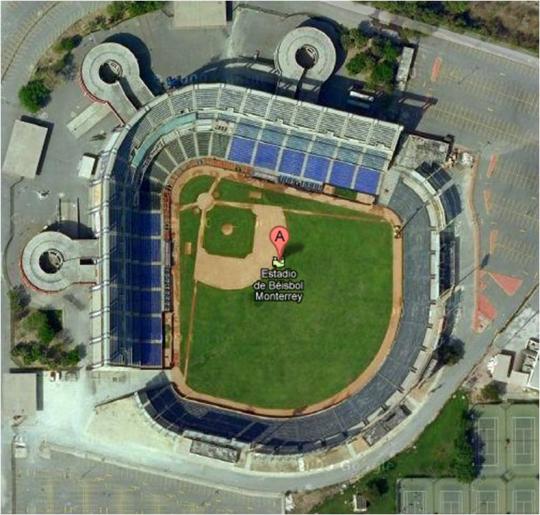
Monterrey, Mexico would seem to be a possibility as their Mexican League team attendance surpasses any American minor league team's. Also, they would virtually become a national team as opposed to a regional team so would have great TV and licensing potential. They already play in a 27,000 seat facility (below) so could put in a few extra outfield seats to easily expand to 33,000 - 35,000 seats.
-
Article: 10 Things To Do And See At TwinsFest
Teflon replied to Kirsten Brown's topic in Twins Daily Front Page News
One thing I like about Twins fest that has a little variety from year-to-year is the past stars from the rest of baseball who appear. Hall of Famer Bob Feller (rest in peace) used to sign autographs and plug his museum in Van Meter, Iowa and the self-dubbed "Black Aces" (Fergie Jenkins, Vida Blue, Mudcat Grant, Dave Stewart, etc.) had a table recently which was cool. http://cdn.bleacherreport.net/images_root/slides/photos/001/171/535/bob_feller11_display_image.jpg?1312875785 -
Pitching: If you’re a young pitching prospect looking for an early debut in the bigs, you clearly want to be drafted and developed by the Atlanta Braves. Of the 33 Braves pitchers that debuted with the club in the last 10 years, 15 of them (46%) have been under age 23 including such youngsters as Julio Teheran, Kyle Davies, Tommy Hansen, and Craig Kimbrel. The average Braves pitcher making his debut is 23.6 which, along with the Florida Marlins, is the youngest average team debut age. Twins pitchers, on average, are 24.3 when they debut with only 6 of 34 having been younger than 23. (17.6%) Both of these numbers are near average as the typical MLB pitcher over the last 10 years debuts at 24.3 and 20.2% have been under 23. At the bottom of the age spectrum, the Houston Astros have had only two of their 33 pitchers debut before the age of 23. (8.6%) Guessing this is not as much by plan as by lack of talent. Hitting: Atlanta is also near the top in debuting young hitters, ranking 2nd overall to the Seattle Mariners. The M’s have had 12 of their 37 position players reach the majors before their 23rd birthday over the last 10 years (32.4%) including Rene Rivera, Adam Jones and Shin-Soo Choo. The worst team is the Pittsburgh Pirates who have only had two of their 36 position players (Jose Tabata and Anfrew McCutcheon) make entrances before the age of 23 - which may be for the same reason as for the Astros pitchers. The Twins are again middle of the back in this category with an average player debut of 24.8 (MLB Average is 24.3) and 20.0% of the debuts being made by players younger than 23. (MLB Average 20.3)
-
Rationalize that at least half of the players in the game are still of major-league quality unless the Royals are in town. Bring some additional friends to the game. (If the friends are Jack Daniels or Johnnie Walker, all the better.) Text the Twins’ in-game Twitter account to ask them why they are continuing to let TC Bear roam around the ballpark without any pants. See who can find the most look-alikes for famous persons’ heads in your bag of peanuts. (Richard Nixon doesn’t count as most peanuts already look like Nixon.) Take a walking tour of the Warehouse District to spot all the lamp post banners still featuring ex-Twins. Apply a new SABRmetric stat of your own making that rates Twins players on how well they “get after it.” Ask the nearby hottie in the Joe Mauer jersey if she realized there’s both a ME and U in Mauer. For early April games, bring a Lean Cuisine to cook on your head under one of the industrial heat lamps in the concourse.
-
Observations on the Ebb and Flow of the Gardenhire Era
Teflon commented on Teflon's blog entry in Blog Teflon
Eb and Flo http://hall-fame.com/eb_flo.jpg -
Observations on the Ebb and Flow of the Gardenhire Era
Teflon commented on Teflon's blog entry in Blog Teflon
In looking at average team WAR in the American League over the 11 years of the Gardenhire era, we see consistent yearly offensive values of +19 wins, pitching values of +13 wins, and fielding values of zero. Comparing the Twins’ performances in each of the Gardenhire seasons to those averages gives us a quick picture of the successes or failures each season and how the offensive, pitching, and fielding prowess of the Twins has trended. 2004-2006. Do I need to say it? Johan Santana was one helluva pitcher. He alone tacked on another 10+ wins to the Twins bottom line in each of the years from 2004 to 2006. With Joe Nathan arriving in 2004 to close out games, this may have been the best stretch of pitching in Twins history. Unfortunately, Twins bats were below league average in two of those seasons. The one year they did manage to field an average offense, 2006, the Twins won 96 games. In my biased remembrance, however, I thought the bats were prodigious that year - Mauer and Morneau each with OPS’s over .900, Cuddyer and Hunter combining to drive in 200 runs. Problem was, the rest of the league was equally as prodigious. The Twins scored 801 runs. The league average was 804. One more banger in the lineup instead of the at-bats taken up by Tony Batista or Rondell White or Lew Ford and maybe the 2006 Twins could have done better than a three-and-out vs. Oakland in the playoffs. 2008-2010. Morneau and Mauer continued to punish the ball when healthy and Cuddyer was his usual self, but throw in Jason Kubel emerging in 2008 and 2009 and some Jim Thome mojo in 2010 and this was the best offensive production compared to the rest of the league of the Gardenhire era. 2010 was, in fact, the peak of output for Gardy’s tenure (+24.9 WAR) despite how much Target Field was maligned as being unfriendly to hitters. Of course WAR is a weirdly constrained stat in that it starts with the team’s wins and reverse engineers itself. Offense or pitching can produce some inflated WAR numbers when the team wins despite what the actual run production was. In 2010, the offense scored 781 runs, fewer than in 2006 - but now above a league average that had dropped to 721 runs per team. (Does anyone else think it’s significant that league average runs declined by 10% in 4 years?) Anyway, if it was the Twins’ intention to build toward having their best all-around team for the opening of the new ballpark, they succeeded. Both their pitching and offense were strong in 2009 and 2010 – the only years of the Gardenhire era that both were at such levels simultaneously. 2005. The Gardenhire era’s best fielding team in a WAR-sense (+3.2) and the worse offensive team. (+6.9) Many of the same players can take credit for both accomplishments: Nick Punto, Juan Castro, and Jason Bartlett. This season was a point of departure for the club as, for the next 6 years, the Twins’ defensive WAR trends downward while the offensive WAR trends upward. The defense actually falls below the AL team average in 2008 and doesn’t rise back above until 2012. Coincidentally, Delmon Young’s service with the Twins coincides with the defensive depression from 2008 to 2011 when he posted WAR values in the field of -1.9 in 2008, -1.2 in 2009, -1.9 in 2010, and -0.5 in a half-season in 2011. Considering that defensive WAR is weighted by the relative importance of defensive positions so that corner outfield spots are attributed the least, Young’s numbers are even more staggering. (Staggering also often described his routes to fly balls in LF) 2012. With a modicum of pitching last year, the Twins could have been an okay team. Their offense rebounded nicely from 2011 to produce at league average and their defense improved considerably. Actually, considering the low win total to start the defensive calculation from, a fielding WAR of +2.6 compared to -7.7 the year before is a monumental turnaround. The middle infield defense of Jamey Carroll, Alexi Casilla, and Pedro Florimon were nearly +5 wins in 2012 while the 2011 combination of Nishioka, Tolbert, Plouffe, and Casilla was -2.8. Losing Jason Kubel’s and Delmon Young’s defense in the outfield in favor of Ben Revere and increased Span innings also didn’t hurt. While I thought the 2012 defense was just okay, these comparisons make me think better of it. [ATTACH=CONFIG]3022[/ATTACH] -
-
New Twins Bench Coach Terry Steinbach - Back in the Day
Teflon replied to Teflon's topic in Minnesota Twins Talk
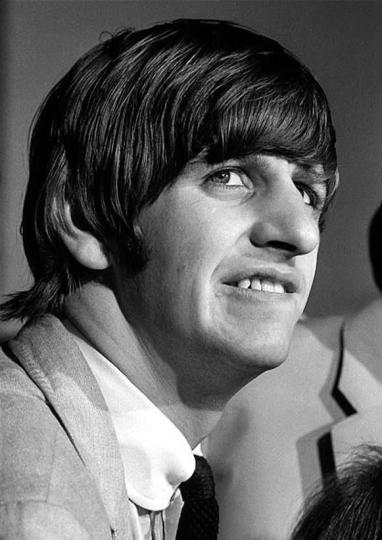
I think this guy was the lead guitar player...
-
Saw this early picture of Steinbach and am trying to remember the name of that band that he played in before going on to his baseball career...
-
I can guarantee you Byron Buxton won't be playing in Beloit next season as McDaniel stated on Fangraphs since the Snappers are now an affiliate of the Oakland A's.
-
-
Originally, I was curious to see how the number of defensive chances handled by outfielders have changed over the years. Using the Lahman database, I summed all putouts, errors, and assists credited among the three outfield positions each season and divided by their sum of innings-played-outs times 27 outs times the 3 positions. This gave me the following trend since 1954 when the data started being available in the Lahman database: [ATTACH=CONFIG]2953[/ATTACH] I saw three trends in this information. The number of chances handled by outfielders per game declined from the mid 50s to the mid 60s. The number of chances handled by outfielders rose steadily from the mid 60s to the mid 70s and then maintained a 20-year plateau. The number of chances handled by outfielders has been declining since the early 90s. In thinking about what could be causing the trends, some occurrence of the following factors seemed likely: expansion in the 60s, changes to the pitching mound in the 60s, the introduction of the DH in the AL in the 70s, the influx of new large multi-sport stadiums in 70s, the emergence of artificial turf in the 70s, the abandonment of large multi-sport stadiums and Astroturf for smaller ballparks and more natural grass in the 90s and 2000s, and expansion in the 90s. I assumed that some Ks in the AL form the pitchers batting would be converted to IF or OF chances and that the multisport stadiums created more opportunities for outfielders than their preceding ballparks due to more foul ground, deeper dimensions, and more balls getting through the infield due to Astroturf. Subsequently, it seemed logical then that as the next wave of ballpark design took over, the outfield numbers would dip again as more and more teams went back to ballparks with natural grass, less foul territory, and generally smaller dimensions. I then wanted to see how the total chances for infielders and catchers reacted over the same period to see if this supported the outfield assumptions. [ATTACH=CONFIG]2954[/ATTACH] The variation in the outfield total chances over the years has been offset by opposite variances in the catchers’ total chances. The two together have been gently climbing, however, with the somewhat shocking result that infielders have seen a steady decline from around 24 total chances per game in the early 80s to nearly 3 fewer per game at present. Situational pitching may be affecting the trends as well. Teams generally carried only 10 pitchers into the 80s meaning starters went longer into games and relievers’ stints were longer, too. The move to larger pitching staffs somewhat increases the likelihood of strikeouts. Will the trend of baseball producing fewer chances for infielders continue to the point where the majority of putouts are eventually K’s or fly balls prompting teams to eventually employ new defensive alignments? (Something like the Thome shift becomes the norm?)
-
10. Additional drink rails added in RF allowing fans to drown greater number of sorrows 9. The only MLB team premium-pricing Twins games on a 2013 schedule is the Twins. 8. Doctors seeking additional 2013 rehab opportunities for Minny’s and Paul’s atrophying elbow joints. 7. Most popular member of 2013 Twins caravan is driver, Lou, who does tricks with false teeth. 6. Mauer’s once Sampson-like sideburns continue to mysteriously recede. 5. Daffodils atop of outfield fences are removed after Twins batters complain they are interfering with potential homeruns. 4. In a season-long promotion, Twins honor 40th anniversary of 1973 team that went 81-81. 3. Paul Molitor to check with Twins before taking any extended vacations this summer. 2. Kevin Correia 1. No additional bulbs requisitioned by stadium maintenance for middle three letters of T-W-I-N-S scoreboard sign.
-
...is correct. The Hawk had a rough tenure as a member of the Twins starting rotation going 23-40 from 1997-1999. In 1999, he gave up a whopping 238 hits in only 174.1 innings (12.3 H/9) on the way to posting a very Omen-like 6.66 ERA. The Twins then sent him to the bullpen where after an inconsistent residency as the closer he found his niche as one of the A.L.'s better setup men in 2002 and 2003.
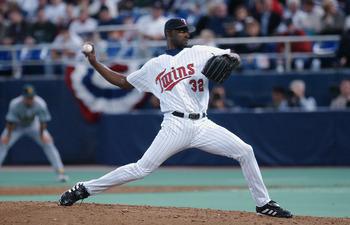
-
What Twins pitcher to make 30 or more starts in a season surrendered the most hits per 9 innings? Clue: It’s not Carlos Silva
-
Isn't Neal Huntington just another way of saying Ben Cherington?
-
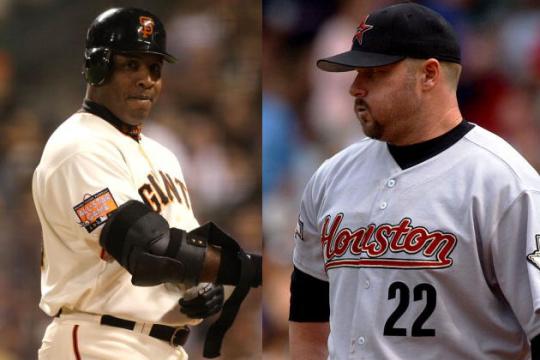
With the upcoming Hall or Fame Vote and the presence of a number of steroid-linked players on the ballot, would the issue be as off-putting for voters if Barry Bonds and Roger Clemens had been pleasant human beings? Are some baseball writers actually glad to have the steroids issue to hold over Bonds' and Clemens' heads as a payback for their being jerks most of their careers - even if it means setting a standard that too severely judges the other players from that era?
-
Article: What Could Nick Punto Bring To The Twins?
Teflon replied to Cody Christie's topic in Twins Daily Front Page News
I savor the gentle wit of this reply. -
Former Twins pitcher Frank Pastore dead at 55
Teflon commented on jjswol's blog entry in Blog jjswol
Sorry to hear of his passing. Strange indeed how he talked about the very scenario of his motorcycle accident and death on his last radio show. -
Thanks, Seth. I also enjoyed this article on Mauer published towards the end of last season in ESPN the magazine.
-
Jeff Kent had the 10th best OPS among 2B in 2000 for SF when he hit .334 /.424./.596 with 33 HR and 125 RBIs. Nap Lajoie was the other missing 2B with a .426/.463/.643 season in 1901 (6th overall among 2B) with 232 hits, 14 HR and 125 RBI. Joe Morgan had the 11th best OPS in 1976 with .320/.444/.576 and 27 HR with 111 RBI. (And the 17th best OPS in 1975)
-
Knoblauch's 1996 ranks 21st in single season OPS among 2Bs. Carew's best OPS season as a 2B was in 1975 which ranks 46th overall. Among just Twins' 2Bs, Knoblauch had the third best OPS season in 1995 followed by Carew's seasons in 73, 74, and 69.


