



John Bonnes
-
Posts
6,794 -
Joined
-
Last visited
-
Days Won
4
Content Type
Profiles
Minnesota Twins News, Rumors & Analysis
Minnesota Twins Videos
2026 Minnesota Twins Top Prospect Rankings
2022 Minnesota Twins Draft Picks & Signing Bonuses
Minnesota Twins Trade & Free Agent Rumors
Minnesota Twins Fan Guides & Resources
2023 Minnesota Twins Draft Picks & Signing Bonuses
The Minnesota Twins Players Project
2024 Minnesota Twins Draft Picks & Signing Bonuses
2025 Minnesota Twins Draft Picks & Signing Bonuses
2026 Minnesota Twins Draft Picks & Signing Bonuses
Forums
Blogs
Events
Store
Downloads
Gallery
Everything posted by John Bonnes
-
 You can view the page at http://twinsdaily.com/content.php/2688-Gleeman-and-the-Geek-Episode-134-Cribs-Mat-Garza-and-Bathroom-Etiquette
-
Gleeman and the Geek, Episode 134: Cribs, Mat Garza and Bathroom Etiquette
John Bonnes posted a blog entry in TwinsGeek.com
-
Gleeman and the Geek, Episode 134: Cribs, Mat Garza and Bathroom Etiquette
John Bonnes posted an article in Twins
Aaron and John go on a tour of Aaron's new place in Uptown and talk about Matt Garza reportedly turning down the Twins' sizable offer, Pedro Florimon's grasp on the shortstop job, when not to use someone's bathroom, Liam Hendriks' waiver wire tour, investing in a marriage, working from coffee shops, Josh Willingham's future, our survey, mailbag questions from listeners, hanging out at Bar Abilene with Meatsauce, speed dating, and the joys of parking. You can listen by clicking below, or download us from iTunes, Stitcher or find it at GleemanAndTheGeek.com.[PRBREAK][/PRBREAK] Here's the breakdown: 0:30 – Aaron’s new Uptown Bachelor Pad tour. 6:00 – Getting stuck in the snow 11:30 – Aaron Gleeman = Scott Seekins 13:30 – Coffee shop etiquette 16:05 – Bar Abilene 19:00 – Pedro Florimon 21:30 – Shortstop options 25:30 – Becoming Yankee fans 27:40 – Matt Garza 38:00 – Josh Willingham Wants To Stay 41:20 – Matt Guerrier delay 43:30 – Matt Capps is hurt 45:30 – CC Sabathia 48:00 – Playing basketball 51:15 - Liam Hendriks 53:30 – CenturyLink and bathroom etiquette 1:02:00 – Working from a coffee house 1:05:00 – Modern Marriage 1:17:00 – Uptown Notes 1:18:40 – Speed Dating Event 1:21:20 – Our Survey 1:23:00 – Mailbag -
You can view the page at http://twinsdaily.com/content.php/2687-Who-ARE-You-People-!
-
We know a lot of you, but it turns out that our potential sponsors don't want to know your opinion on the designated hitter. They just want the basics - age, location, that stuff. So we created a very short and anonymous survey. It'll take less than 45 seconds, I promise. Could you each please click over and fill it out quickly, so we can get back to baseball? Thank you. [PRBREAK][/PRBREAK]
-
Article: Catch Framing Predictability
John Bonnes replied to John Bonnes's topic in Twins Daily Front Page News
Re: the concerns With umpires - you would think if the umpires were that important in this study, the results of the correlation would be more random, right? It's not like a catcher's umpires that he happens to catch in front of are consistent from year to year. Re: pitching staffs - I just reran the same study, only this time, I only chose catchers who also changed teams from one year to the next. That would seem to negate the impact of pitchers. It came back with only 46 examples (as opposed to 189 from the previous study) so there is a higher deviation, but the results were still ridiculously strong: .68 for the season and .75 for pitches per game. This is a skill, folks. -
You can view the page at http://www.twinsdaily.com/content.php/2685-Catch-Framing-Predictability
-
There has been more and more talk lately about catcher framing, which is the ability of catchers to impact the runs scored in a game by garnering strikes from pitches outside the strike zone. My initial skepticism around it has largely been due to the huge impact it can have. For instance, last year the difference between the best pitch framer (Jonathan LuCroy) and the worst (John Buck) is estimated at 50 runs. That's a five win difference. That's hard to believe.[PRBREAK][/PRBREAK] But today I wanted to look at different aspect: its predictability. That is, if a catcher is good at framing in one year, can we reasonably assume that he'll be good at it the next year? One way to look at this is to look at all catchers and how they did from year to year. If they did well one year, did they do well the next and vice versa? (I wondered about this because I was looking up Kurt Suzuki's framing numbers. They're usually been negative, but there have been some positive ones sprinkled in. I wondered how common that is.) There is a neat little statistical gizmo to do this called a correlation coefficient. A correlation coefficient examines two sets of numbers and gives back a number between -1 and 1. 1 means there is a perfect correlation, like between the temperature in Celsius and the temperature in Fahrenheit. -1 means there is a perfectly negative correlation, like the amount you spend in a month and your checking balance. And if it's 0, that means the numbers have no correlation, like Joe Mauer's batting average and the migratory penguin population. You can find the results of my study here. The bottom line: there is a lot of predictability. The runs per season had a correlation of .76, which is high. But the correlation on pitches per game is even higher .82. So catchers who have had a large positive effect end up continuing to do so. Unfortunately, most of the Twins who will play catcher this year didn't have a large positive effect last year. In fact, none of them did: Kurt Suzuki: -9.1 Josmil Pinto: -4.3 Chris Herrmann:-4.6 Eric Fryer: -0.8 I didn't choose that order to emphasize the negative. I chose to list them in my predicted order of innings caught. It's almost as if the worse they are at pitch framing, the more likely they are to play catcher. And this is where John starts rubbing his temples. And yet, that still might be better than last year. Because last year Joe Mauer was average (0.4) and Ryan Doumit was horrendous (-15.9). Still, it appears the new catching corps may not do the Twins revamped pitching staff any favors this year. ~~~ Since I'm sure you might want to do something like this yourself (and really, why wouldn't you - YEAY MATH), I thought I'd spell out the steps. 1. I pulled all the data I could from this great site and pasted it into a spreadsheet. It has all the catcher framing data from 2013 through 2007. 1b. I forgot to mention - I also limited the study to catchers with at least 3000 "samples" in a season which I assume are pitches. 2. I added one column to that data: "Prev Yr." You'll see why in a minute. 3. I imported that spreadsheet into an Access DB twice, once as a table called "Following" and another as "Previous". 4. I created a query joining those two tables, joining fields First Name, Last Name and "Prev Yr" from following to "Year" from the Previous field. I pulled the Names, Years, Per Game and RAA fields from each table. 5. Copy and paste the results from the query back into an Excel spreadsheet. 6. Use the "Correl" function to compare the values in the two "Per Game" and two RAA" fields. Ta Da!
-
There has been more and more talk lately about pitch framing, which is the ability for catchers to impact the runs scored in a game by garnering strikes from pitches outside the strike zone. My initial skepticism around it has largely been due to the huge impact it can seem to have. For instance, last year the difference between the best pitch framer (Matt LuCroy) and the worst (John Buck) is estimated at 50 runs. That's a five win difference. That's hard to believe. But today I wanted to look at a different aspect: its predictability. That is, if a catcher is good at framing in one year, can we reasonably assume he'll be good at it the next year? One way to look at this is to look at all catchers and how they did from year to year. If they do well one year, will the do well the next and vice versa? (I wondered this because I was looking up Kurt Suzuki's framing numbers. They're usually been negative, but there have been some positive ones sprinkled in. I wondered how common that is.) There is a neat little statistical gizmo to do this called a correlation coefficient. A correlation coefficient examines two sets of numbers and gives back a number between -1 and 1. 1 means there is a perfect correlation, like between the temperature in Celsius and the temperature in Fahrenheit. -1 means there is a perfectly negative correlation, like the amount you spend in a month and your checking balance. And if it's 0, that means the numbers have no correlation, like Joe Mauer's batting average and the migratory penguin population. You can find the results of my study here. The bottom line: there is a lot of predictability. The runs per season had a correlation of .76, which is high. But the correlation on pitches per game is even higher .82. So catchers who have had a large positive effect end up continuing to do so. Unfortunately, most of the Twins who will play catcher this year didn't have a large positive effect last year. In fact, none of them did: Kurt Suzuki: -9.1 Josmil Pinto: -4.3 Chris Herrmann:-4.6 Eric Fryer: -0.8 I didn't choose that order to emphasize the negative. I chose listed them in my predicted order of innings caught. It's almost as if the worse they are at pitch framing, the more likely they are to play catcher. And this is where John starts rubbing his temples. And yet, that still might be better than last year. Because last year Joe Mauer was average (0.4) and Ryan Doumit was horrendous (-15.9). Still, it appears that new catching corps may not be doing the Twins revamped pitching staff any favors this year. ~~~ Since I'm sure you might want to do something like this yourself (and really, why wouldn't you - YEAY MATH), I thought I'd spell out the steps. 1. I pulled all the data I could from this great site and pasted it into a spreadsheet. It has all the catcher framing data from 2013 through 2007. 2. I added one column to that data: "Prev Yr." You'll see why in a minute. 3. I imported that spreadsheet into an Access DB twice, once as a table called "Following" and another as "Previous". 4. I created a query joining those two tables, joining fields First Name, Last Name and "Prev Yr" from following to "Year" from the Previous field. I pulled the Names, Years, Per Game and RAA fields from each table. 5. Copy and paste the results from the query back into an Excel spreadsheet. 6. Use the "Correl" function to compare the values in the two "Per Game" and two RAA" fields. Ta Da!
-
[attachment=6871:4039.attach]There has been more and more talk lately about pitch framing, which is the ability for catchers to impact the runs scored in a game by garnering strikes from pitches outside the strike zone. My initial skepticism around it has largely been due to the huge impact it can seem to have. For instance, last year the difference between the best pitch framer (Matt LuCroy) and the worst (John Buck) is estimated at 50 runs. That's a [I]five win [/I]difference. That's hard to believe. But today I wanted to look at a different aspect: its predictability. That is, if a catcher is good at framing in one year, can we reasonably assume he'll be good at it the next year? One way to look at this is to look at all catchers and how they did from year to year. If they do well one year, will the do well the next and vice versa? [I](I wondered this because I was looking up Kurt Suzuki's framing numbers. They're usually been negative, but there have been some positive ones sprinkled in. I wondered how common that is.)[/I] There is a neat little statistical gizmo to do this called a correlation coefficient. A correlation coefficient examines two sets of numbers and gives back a number between -1 and 1. [LIST] [*]1 means there is a perfect correlation, like between the temperature in Celsius and the temperature in Fahrenheit. [*]-1 means there is a perfectly negative correlation, like the amount you spend in a month and your checking balance. [*]And if it's 0, that means the numbers have no correlation, like Joe Mauer's batting average and the migratory penguin population. [/LIST] You can [URL="https://docs.google.com/spreadsheet/ccc?key=0Au8jvp4eyF3CdHpmVk50RnAtd20tYk03emNpTFo3bnc&usp=sharing"]find the results of my study here[/URL]. The bottom line: there is a lot of predictability. The runs per season had a correlation of .76, which is high. But the correlation on pitches per game is even higher .82. So catchers who have had a large positive effect end up continuing to do so. Unfortunately, most of the Twins who will play catcher this year didn't have a large positive effect last year. In fact, none of them did: Kurt Suzuki: -9.1 Josmil Pinto: -4.3 Chris Herrmann:-4.6 Eric Fryer: -0.8 I didn't choose that order to emphasize the negative. I chose listed them in my predicted order of innings caught. It's almost as if the worse they are at pitch framing, the more likely they are to play catcher. And this is where John starts rubbing his temples. And yet, that still might be better than last year. Because last year Joe Mauer was average (0.4) and Ryan Doumit was horrendous (-15.9). Still, it appears that new catching corps may not be doing the Twins revamped pitching staff any favors this year. [CENTER]~~~[/CENTER] [I]Since I'm sure you might want to do something like this yourself (and really, why wouldn't you - YEAY MATH), I thought I'd spell out the steps. 1. I pulled all the data I could from [URL="http://statcorner.com/CatcherReport.php"]this great site[/URL] and pasted it into a spreadsheet. It has all the catcher framing data from 2013 through 2007. 2. I added one column to that data: "Prev Yr." You'll see why in a minute. 3. I imported that spreadsheet into an Access DB twice, once as a table called "Following" and another as "Previous". 4. I created a query joining those two tables, joining fields First Name, Last Name and "Prev Yr" from following to "Year" from the Previous field. I pulled the Names, Years, Per Game and RAA fields from each table. 5. Copy and paste the results from the query back into an Excel spreadsheet. 6. Use the "Correl" function to compare the values in the two "Per Game" and two RAA" fields. Ta Da![/I] View full article
-
-
I was just commenting in a blog about how early top prospects are send down to the minors. Last year, Gibson was optioned to AAA on 3/14, ending any speculation that he might make the Opening Day roster very early. In some ways, it's a pretty efficient way to handle things: they get some time to hang out with major leaguers, still spend most of their time in minor league camp, and it keeps down the swirl surrounding whether or not they make the Opening Day roster. I'm wondering if this year's example will be Sano. Thus, this thread on when the Twins will send him down, so we can all be prepared. I'll put the over/under at 3/13. Which side do you take? (P.S. Hicks might be another example.)
-
Byron Buxton Could Push Aaron Hicks This Season
John Bonnes commented on Troy Larson's blog entry in Blog Troy Larson
Thank you for contributing. I look forward to seeing your writing develop. I have to agree with the other comments - it would take an armageddon-like scenario for Buxton to break camp with the Twins. If either Presley or Mastroianni or Hicks is healthy, they would be the center fielder. And to be honest, I think the Twins still might not make Buxton the center fielder. It'll be interesting to watch how long Buxton is on the team this spring. It's not unusual for a top prospect like him to be sent down very early, like within the first week or so of games. He'll have had a chance to hang out with big leaguers for a couple of weeks and for the coaching staff to see him up close. But sending him down early gives him a full camp with the minor leaguers and also keeps speculation away about whether he could break camp with the team. -
(John curls into the fetal position)
-
Jim Souhan lays out a very reasonable argument for signing Josh Willingham to an extension, while also acknowledging his faults. http://www.startribune.com/sports/twins/246267161.html
-
Article: Twins Daily Newsroom
John Bonnes replied to John Bonnes's topic in Twins Daily Front Page News
Just a reminder as spring training starts - this is a nice page to bookmark to see the latest news from any number of sources that often talk about the Twins. -
Well, I'm glad to see that at this point, there aren't a Big 4 that the Twins are just going to miss out on. (Though there is plenty of time for that yet, of course.) I guess I'm not picky. I'm not opposed to an outfielder if he's clearly better than the other options, but if it's close, a SS or C sure sounds tasty. A college pitcher might serve as a nice bridge to some of the low minor arms we have coming. It feels like Day 1 is going to be a good day.
-
Desktop critical error message?
John Bonnes replied to edavis0308's topic in Twins Daily Issues & Suggestions
Thanks. Brock, let me know if I need to follow up with any ad company about this. -
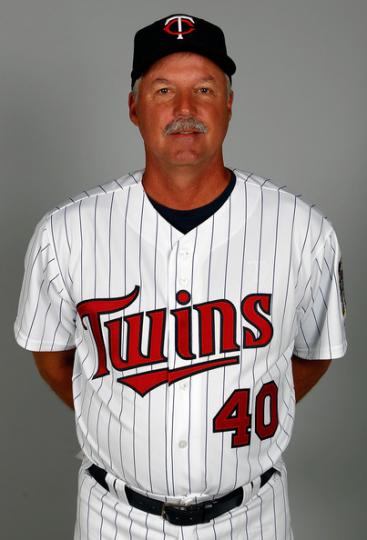
Coaches are eligible, right? (I love this thread.)
-
Article: Spring Training Preview
John Bonnes replied to Nick Nelson's topic in Twins Daily Front Page News
That's a good question. We'll be in the pressbox but also wandering around, I would guess, trying to see the game from different areas. We will have some "Twins Daily" polo shirts on occasion, but probably not every day. Look for our gorgeous mugs, I guess? Or maybe we'll tweet out someplace for postgame cocktails? -
Berardino: Willingham wants to finish career with Twins
John Bonnes replied to Seth Stohs's topic in Minnesota Twins Talk
It's nice that he likes it here. If some guys fail to develop, that might make sense. -
Article: Spring Training Preview
John Bonnes replied to Nick Nelson's topic in Twins Daily Front Page News
Giddy-Freaking-up! -
Or Escobar.
-
You can view the page at http://twinsdaily.com/content.php/2673-Gleeman-and-the-Geek-Episode-133-Pitchers-and-Catchers-Report
-
Gleeman and the Geek, Episode 133: Pitchers and Catchers Report
John Bonnes posted an article in Twins
Aaron and John visit Rye Deli on the same day the offseason ends and discuss what we want to see from the 2014 Twins, what to expect from the pitching staff and how to start their own bar with zero experience. You can listen by clicking below, or download us from iTunes, Stitcher or find it at GleemanAndTheGeek.com. [PRBREAK][/PRBREAK] Here's this week's breakdown: 2:00 - Aaron’s moving update 3:30 – Brunch 4:20 – Players in the best shape of their life 8:00 – John & Aaron’s public speaking schedule 14:00 – John meeting Aaron’s Mom 17:30 – Twins claiming LHP Brooks Raley 24:30 – Underrating and overrating Derek Jeter 37:20 – Rye Deli owner David Weinstein tutors John & Aaron on how to start a restaurant/bar with no experience 44:30 – What’s important for the Twins 2014 season? 59:40 – What can we expect from the starting rotation in 2014? 1:05:00 – Valentine’s Day 1:12:00 – Mailbag 1:29:00 – The first kiss 1:31:30 – Parker’s Second Chance Video
