



Andrew Thares
-
Posts
653 -
Joined
-
Last visited
Content Type
Profiles
News
Minnesota Twins Videos
2026 Minnesota Twins Top Prospects Ranking
2022 Minnesota Twins Draft Picks
Minnesota Twins Free Agent & Trade Rumors, Notes, & Tidbits
Guides & Resources
2023 Minnesota Twins Draft Picks
The Minnesota Twins Players Project
2024 Minnesota Twins Draft Picks
2025 Minnesota Twins Draft Pick Tracker
2026 Minnesota Twins Draft Tracker: Picks & Bonuses
Forums
Blogs
Events
Store
Downloads
Gallery
Everything posted by Andrew Thares
-
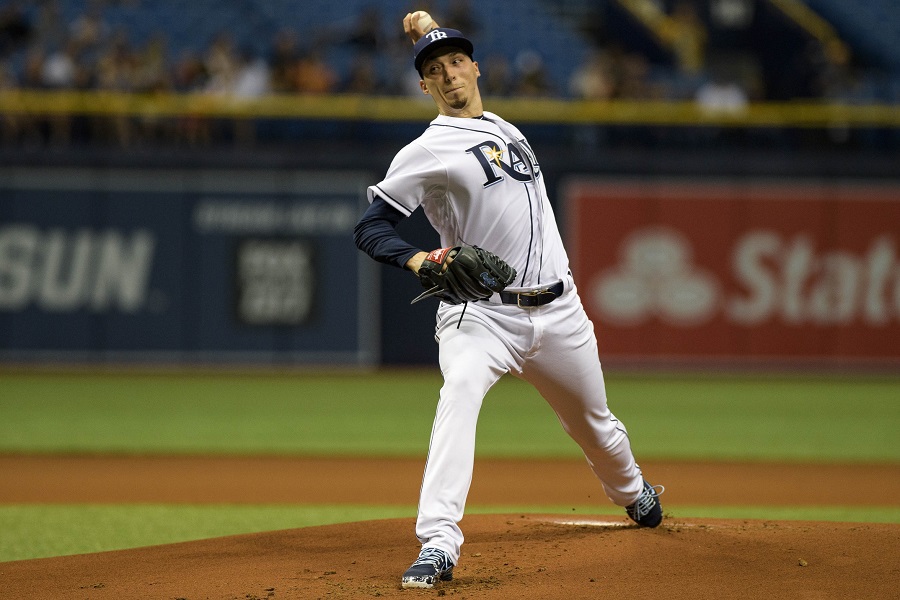 Snapshot (chart via FanGraphs) Blake Snell was dealing tonight for the Rays. The Twins played some small ball to put up a run on him in the first, but then Snell shutdown the Twins for the next six-innings before he stranded Robbie Grossman on third to end his night in the seventh. Snell was one of the Rays more highly touted pitching prospects as he was coming up through the minors, but he struggled with control issues during his first two seasons in the majors. However, Snell appears to have found his form in 2018, and is showing off his nasty stuff with pitches like this one to strikeout Eddie Rosario in the second. https://twitter.com/PitchingNinja/status/987823886766084096 Kyle Gibson was having a strong start, having given up just a two-run home run through his first six innings of work. However, things unraveled in the seventh, where Gibson and Gabriel Moya combined to give up five runs to let the Rays blow the game open. C.J. Cron had himself a day, belting two two-run home runs, one in third and the other in the five-run seventh. Both home runs were carbon copies of each other, as the second lander just four seats over from where the first one ended up. Denard Span came up big for the Rays again tonight after he came up with a two-out, two-RBI base hit up-the-middle during the seventh inning to expand the Rays lead to 5-1, the Rays would late expand the score to 7-1 in the seventh off Cron’s second home run of the night. The Twins tried to get a rally going in the eighth, getting the first two runners on with the top of the order coming up. However, Rays reliever Matt Andriese quickly shut the door by striking out Brian Dozier and getting Joe Mauer to ground into an inning-ending double play. The Rays added onto their lead in the bottom half of the eighth when Daniel Robertson blasted a 431- foot bomb to centerfield off Tyler Kinley bring the score to 8-1. That was followed by a walk and three more singles, including another RBI single from Denard Span. When all was said and done the score stood at 10-1 in favor of the Rays. The Twins did have a sparkling night defensively. First, Ehire Adrianza robbed Denard Span in each of his first two at-bats with defensive web gems at short. Here was the second one during the third inning. https://twitter.com/fsnorth/status/987828546369347584 During the 4th inning Miguel Sano showed off his rocket of an arm to nab Daniel Robertson to get the second out of the inning. Then Mauer followed it up by spearing a ground ball off the bat of Wilson Ramos to end the inning. Next Three Games Sun at TB 12:10 pm CT Mon at NYY 6:05 pm CT Tues at NYY 5:35 pm CT
-
It never hurts to look into different statistics to see if they can improve the quality of your model, but personally I don't think adding BABIP will help for a couple of reasons. First, its is not the luck based stat that many people make it out to be. Certain players, and even certain ballparks, produce a higher BABIP based on their skill and dimensions respectively. So to try an set a league wide baseline and assume that players will naturally regress to that just isn't the way it works. Second, and perhaps more importantly, it is a batting average based stat, and I'm sure you understand the limitations of using batting average when comparing it to more complete stats like wRC+. For finding solid contact and flares & burners they are available at baseball savant as well. The problem is I don't think there is an easy table to pull with the data like there is with Barrels. The only place I've seen them is on individual players radial charts on the site. To find them you can go to Statcast Search>Fliter to:Player Type(Batter),Season(2017),Min ABs(None). This should give you every player who took an at-bat last season. Then you can click on the Graphs button on each batter, and select Radial Chart. Here is where they have that data. At this point it is up to you to decide if you want to go through all the work to pull that data by hand, or if you are good a computer programming you could maybe figure out an easier way to pull it.
-
 Every situation calls for and extra base hit, but they are very hard to do and can't just be created out of thin air. Often times as a hitter you have to take what is given to you, and against a pitcher like Corey Kluber, extra base hits are very rarely given to you.
-
It mostly depends on how much the game is impacted from a win probability prospective. Obviously there are more volatile changes in win probability late in close games, than there are early in games. So those would be defined as high leverage situations. Something like 2nd and 3rd with 1 out in a 2 run game in the 2nd might be defined as a medium leverage situation. Still could be defined as a big moment, but won't have as drastic impact as it would late in the game. While things like Joe batting with 1 out and no one on in the top of the first might be a low leverage situation, since whatever he does (even if its a home run) wont have too big of an impact on the result of the game.
-
Literally what you described here are the high leverage situations that I pointed out in the article. So to answer your question he has a .287/.413/.408 slash line in those situations.
-
Throughout Joe Mauer’s tenure as a Minnesota Twin there have been a lot of narratives, true or not, about him: Not living up to his big contract, his lack of effort to become more of a power hitter, over playing his concussion issues, not being a strong leader in the clubhouse. Another one that I have been hearing is Twins fans’ conception that Joe is not a good hitter in the clutch. Image courtesy of Jesse Johnson-USA TODAY Sports Throughout Joe Mauer’s tenure as a Minnesota Twin there have been a lot of narratives, true or not, about him: Not living up to his big contract, his lack of effort to become more of a power hitter, over playing his concussion issues, not being a strong leader in the clubhouse. Another one that I have been hearing is Twins fans’ conception that Joe is not a good hitter in the clutch. I’m not really sure where this notion was born from, but it seems to be something that I've heard more and more of lately. So, I guess the question to ask is has Joe Mauer been a good performer in clutch? Let’s find out. As we all know, baseball is a game built on situations. With every new batter, and even every new pitch, the situation of the game changes. Some situations have a high impact on the outcome of the game, while others don’t really have much significance to the game’s fate. Here's how Joe's splits break down by leverage over his 15-year career. You many have noticed the stat referred to as tOPS+ and thought to yourself "what in the world is that?" Well, simply put, tOPS+ is a metric developed by our friends at Baseball Reference that is used to measure how well a player preformed in a certain situation relative to their overall performance. A tOPS+ of 100 means that the player had the same OPS in that specific situation as they have overall, while a 105 tOPS+ means their OPS was 5% better in that situation, and vise versa for a tOPS+ of 95. As we can see from the chart, Joe Mauer has excelled over his career in medium leverage situations. However, to be clutch it is important to look at how Joe preformed in high leverage spots. Overall, Joe has a .821 OPS in high-leverage situations, which is 3% lower than his career .835 OPS. Having a tOPS+ of less than 100 in high leverage situations is expected for most hitters, however, as these plate appearances often come late in games against the opposing team’s best relief pitchers. Given that, Mauer’s career .821 OPS in high-leverage situations is actually pretty good. Joe Mauer has also excelled when the Twins have needed him to drive in runs with two outs in the inning. In his career, Mauer has a career .946 OPS, or a tOPS+ of 127 in 808 plate appearances with two outs and runners in scoring position. Over at Fangraphs, they have their own way of calculating how clutch a player has been in their career, with a stat that they refer to simply as Clutch. If you want to read more about how this stat is formulated you can do so here. In the history of the Minnesota Twins, there have been 164 hitters who have had at least 300 plate appearances as a member of the organization, and of those 164, Joe Mauer ranks as the ninth most clutch player. Unsurprisingly, Kirby Puckett and Kent Hrbek rank as the most and second most clutch players in Twins history. While Torii Hunter, Tom Brunansky and Roy Smalley all ranked as the three least clutch players in Twins history. If there is one area that Joe hasn’t been as clutch it has been in the postseason, where he has a modest .641 OPS. While that isn’t a terrible number, it surely doesn’t live up to the expectations that we have for Joe. However, it is hard to put much weight into this number given that it is over just 11 career postseason games, and just one good game can bring those numbers from a little below average to pretty good. In all, I think it is safe to say the Joe Mauer has indeed been a clutch player throughout his career with the Twins, though it would be nice to see him bring up his postseason numbers. Hopefully, with this talented Twins team he will get a shot this year, or potentially in future years if he chooses to return to the Twins after this season. View full article
-
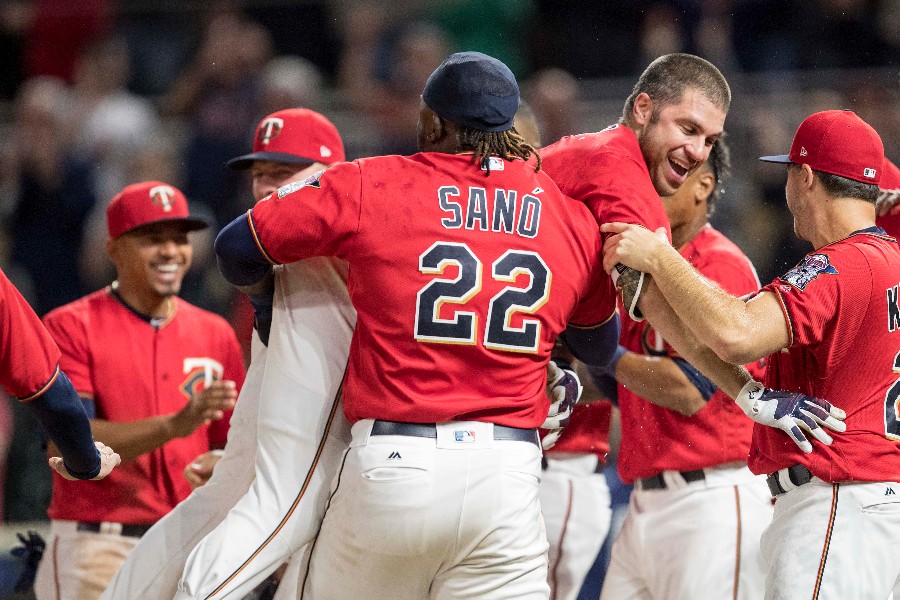 I’m not really sure where this notion was born from, but it seems to be something that I've heard more and more of lately. So, I guess the question to ask is has Joe Mauer been a good performer in clutch? Let’s find out. As we all know, baseball is a game built on situations. With every new batter, and even every new pitch, the situation of the game changes. Some situations have a high impact on the outcome of the game, while others don’t really have much significance to the game’s fate. Here's how Joe's splits break down by leverage over his 15-year career. You many have noticed the stat referred to as tOPS+ and thought to yourself "what in the world is that?" Well, simply put, tOPS+ is a metric developed by our friends at Baseball Reference that is used to measure how well a player preformed in a certain situation relative to their overall performance. A tOPS+ of 100 means that the player had the same OPS in that specific situation as they have overall, while a 105 tOPS+ means their OPS was 5% better in that situation, and vise versa for a tOPS+ of 95. As we can see from the chart, Joe Mauer has excelled over his career in medium leverage situations. However, to be clutch it is important to look at how Joe preformed in high leverage spots. Overall, Joe has a .821 OPS in high-leverage situations, which is 3% lower than his career .835 OPS. Having a tOPS+ of less than 100 in high leverage situations is expected for most hitters, however, as these plate appearances often come late in games against the opposing team’s best relief pitchers. Given that, Mauer’s career .821 OPS in high-leverage situations is actually pretty good. Joe Mauer has also excelled when the Twins have needed him to drive in runs with two outs in the inning. In his career, Mauer has a career .946 OPS, or a tOPS+ of 127 in 808 plate appearances with two outs and runners in scoring position. Over at Fangraphs, they have their own way of calculating how clutch a player has been in their career, with a stat that they refer to simply as Clutch. If you want to read more about how this stat is formulated you can do so here. In the history of the Minnesota Twins, there have been 164 hitters who have had at least 300 plate appearances as a member of the organization, and of those 164, Joe Mauer ranks as the ninth most clutch player. Unsurprisingly, Kirby Puckett and Kent Hrbek rank as the most and second most clutch players in Twins history. While Torii Hunter, Tom Brunansky and Roy Smalley all ranked as the three least clutch players in Twins history. If there is one area that Joe hasn’t been as clutch it has been in the postseason, where he has a modest .641 OPS. While that isn’t a terrible number, it surely doesn’t live up to the expectations that we have for Joe. However, it is hard to put much weight into this number given that it is over just 11 career postseason games, and just one good game can bring those numbers from a little below average to pretty good. In all, I think it is safe to say the Joe Mauer has indeed been a clutch player throughout his career with the Twins, though it would be nice to see him bring up his postseason numbers. Hopefully, with this talented Twins team he will get a shot this year, or potentially in future years if he chooses to return to the Twins after this season.
-
Twins vs. Indians Series Preview
Andrew Thares replied to Andrew Thares's topic in Twins Daily Front Page News
Yeah that scenario is also possible, but it is a lot hard to have happen because you need to both win and have Cleveland lose a different game to gain ground on them as opposed to just beating them straight up. That is why these games against Cleveland are so important. -
This is an interesting study. I think you should look into adding "solid contact" along with "Flares & Burrners" into your study along with Barrels. If you are unfamiliar with these, they are other contact quality measurements as defined by Statcast, like Barrels. I think they will be good to include because they are also contact types that frequently produces base hits (though ones that don't necessarily go for as much power). I think you could use these and then get rid of other contract based stats like average exit velocity, average launce angle, an 95+ MPH to help avoid potential issues with multicollinearity. I would also recommend that when publishing research like this it is often best to make the information as reader friendly as possible. I know it can be difficult with the layout of the site, so I would recommend inserting your data into a clean chart outside of the site, and then uploading a screenshot of your chart. It will look a lot cleaner, and will be easier for your readers to follow along. But all in all this is great work. If you decided to take your research into the topic any further I would love to see your results.
-
I think the biggest thing with Mauer's HOF case is how long can he keep preforming at a high level. If he can do it into his late 30's I think he has a real shot, but if he can only do it for another year or two, its gonna be a tough to see writers voting him in that don't carry the same sense of nostalgia that many of us have for Joe.
- 68 replies
-
- 1
-

-
- joe mauer
- johnny bench
- (and 3 more)
-
Twins vs. Indians Series Preview
Andrew Thares replied to Andrew Thares's topic in Twins Daily Front Page News
It was originally showing Josh Tomlin when I wrote the article, but now it looks like it has been changed to Carrasco. I will get an updated version of this up once I get the chance. -
A Look Back to 2001: Mauer or Prior? (Part 1)
Andrew Thares replied to Seth Stohs's topic in Twins Daily Front Page News
As someone who grew up both a Twins and Cubs fan, I think about this draft often. In all I am glad things worked out the way they did, but sometimes it is so hard not to look back and think what could have been for that Cubs pitching staff. In 2003 they had three legit ACEs in Mark Prior, Kerry Wood and Carlos Zombrano who pitched a combined 636 1/3 innings, with a combined ERA of 2.91 (during the steroid era) and an average age of 23. Then to have my heart broken again in 2006 with what could have been between Santana and Liriano. -
Twins vs. Indians Series Preview
Andrew Thares replied to Andrew Thares's topic in Twins Daily Front Page News
Yeah its a bit of a disadvantage given the fact that Minnesota now plays in Cleveland 10 times, while Cleveland only plays in Minnesota 7 times. They should have at least done it one home game for each. -
The Twins will be escaping the frozen tundra of Minnesota to play a well-timed two-game home stand in Puerto Rico this week against the Cleveland Indians. This will be a great welcome home for Jose Berrios and Eddie Rosario, along with Indians shortstop Francisco Lindor and catcher Roberto Perez. The two games will be played at Hiram Bithorn Stadium in the capital city of San Juan. Image courtesy of Scott R. Galvin-USA TODAY Sports The Twins will be escaping the frozen tundra of Minnesota to play a well-timed two-game home stand in Puerto Rico this week against the Cleveland Indians. This will be a great welcome home for Jose Berrios and Eddie Rosario, along with Indians shortstop Francisco Lindor and catcher Roberto Perez. The two games will be played at Hiram Bithorn Stadium in the capital city of San Juan. Series at a Glance *Win Odds from FiveThirtyEight Minnesota Twins If the Twins have any desire of keeping pace with the Indians this season they will need to play much better against them than they did last year, going 7-12 in 2017. After going on a three-game win streak, the Twins have taken a 0.5 game lead over the Indians the AL Central Division standings. Probable Starting Pitchers RHP Jake Odorizzi Jake Odorizzi has been solid in his first three starts in a Twins uniform. So far Odorizzi is tied for the team lead with two quality starts. Even in Odorizzi’s one poor start of the year he still did a decent job keeping the Twins in the game giving up just three runs over 4.1 innings. Odorizzi made one start against Cleveland in 2017, where he went six innings, and allowed four runs in a 6-4 win for the Rays. RHP Jose Berrios Jose Berrios will undoubtedly be amped up to make a start in his home country of Puerto Rico on Wednesday night. Berrios has looked absolutely dominant in two of his three starts this season, going a combined 16 shutout innings with 17 strikeouts. Berrios will be looking to build off those two starts in what will be his biggest start of the season thus far. Berrios made just one start against the Indians last year, where he was lights out, surrendering just one run, over 7.2 innings. Cleveland Indians Much like the Twins, the Indians felt the effects of the snowstorm over the weekend, as each of the last two games in their series against Toronto were postponed. This is unfortunate news for the Twins, as Corey Kluber was originally scheduled to pitch on Saturday, but has been pushed back to start Tuesday night against the Twins. The Indians bats still haven’t gotten going yet this year, as they have a mere .200 batting average as a team, and currently have league worst 68 wRC+ through the first few weeks of the season. Probable Starting Pitchers RHP Corey Kluber Corey Kluber has established him self as one of baseball's premier pitchers. Over the last four seasons, Kluber has won two AL Cy Young awards and finished in the top-10 in Cy Young voting in the two years he didn’t win the award. Kluber’s curveball is regarded by many as perhaps the best pitch in baseball. Last year, Kluber allowed a staggeringly low .111 wOBA on his curveball and has been even better so far this season. Kluber was dominant in his lone start against the Twins in 2017, where he struck out 13 over seven innings, and allowed just two runs (both unearned). However, the Twins were fortunate enough to escape that matchup with a 4-2 victory. RHP Carlos Carrasco The 2017 Indians starting rotation was arguably the best starting rotation in MLB history, setting the all-time MLB record for fWAR by a starting rotation at 31.7 (2.2 higher than the next best rotation). A big par of that was having Carlos Carrasco as a second ACE in their rotation to complement Corey Kluber. Much like Kluber, Carrasco’s signature pitch is his curveball. Despite his slight dip in strikeouts to start 2018, Carrasco has still had a strong start to his season. Hopefully Carrasco waits at least another start before he returns to form as one of elite strikeout pitchers in the game. Players to Watch Francisco Lindor, SS Francisco Lindor developed himself into a true five-tool player after belting 33 home runs last season. Perhaps the strongest tool of Lindor’s game is his defense. Since he came into the league in 2015, the 24-year-old ranks third among shortstops with 32 Defensive Runs Saved. Lindor has gotten off to a slow start with a .241/.302/.379 slash line. Despite this he has still been the best hitter in the Cleveland lineup. Jose Ramirez, 3B The other half of perhaps the best left-side of the infield in baseball, Jose Ramirez has played a huge part in the Indians’ success over the past couple of seasons. Last year his 56 doubles were the most by any hitter since Todd Helton hit 59 in 2000. He showed his flexibility by playing 71 games at second last season, though he has moved back to his natural position at third with Jason Kipnis healthy again to begin 2018. Edwin Encarnacion, DH Edwin Encarnacion had a change of scenery last season (moving from Toronto to Cleveland) but he didn’t miss a beat hitting a team leading 38 home runs. Encarnacion’s power has been incredibly consistent over the last handful of years, as he has hit at least 34 home runs in every season since 2012. Bullpen Comparison *Represents Minor League Stats Trevor Hildenberger has gotten off to a very discouraging start to the season. Sure, he has a respectable 3.86 ERA, but that doesn’t come close to telling the whole story. One of the most important roles of a relief pitchers is being able to strand inherited runners, and Hildenberger has allowed all seven of his inherited runners to score thus far. Part of this has been his inability to strike out opposing hitters, as he has struck out just 2 of the 30 batters that he has faced. The Indians bullpen suffered a big loss this offseason when Brain Shaw signed with the Colorado Rockies. Nonetheless they still feature maybe the best one-two punch any bullpen has to offer with Andrew Miller and Cody Allen. However, outside of those two the Indians bullpen can be vulnerable. In a move to add some depth to their bullpen, the signed former Twin Matt Belisle. Zone Charts courtesy of baseballsavant.com View full article
-
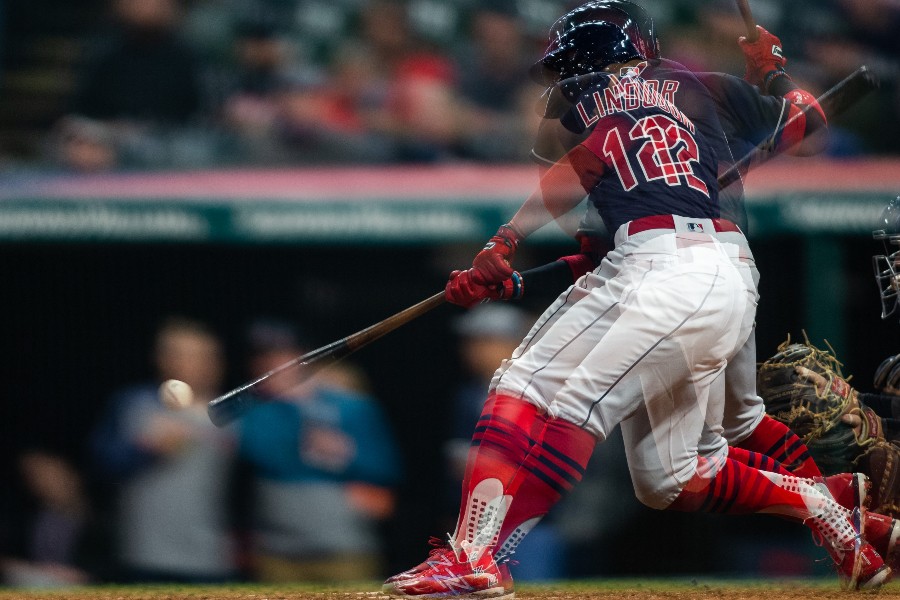 Series at a Glance *Win Odds from FiveThirtyEight Minnesota Twins If the Twins have any desire of keeping pace with the Indians this season they will need to play much better against them than they did last year, going 7-12 in 2017. After going on a three-game win streak, the Twins have taken a 0.5 game lead over the Indians the AL Central Division standings. Probable Starting Pitchers RHP Jake Odorizzi Jake Odorizzi has been solid in his first three starts in a Twins uniform. So far Odorizzi is tied for the team lead with two quality starts. Even in Odorizzi’s one poor start of the year he still did a decent job keeping the Twins in the game giving up just three runs over 4.1 innings. Odorizzi made one start against Cleveland in 2017, where he went six innings, and allowed four runs in a 6-4 win for the Rays. RHP Jose Berrios Jose Berrios will undoubtedly be amped up to make a start in his home country of Puerto Rico on Wednesday night. Berrios has looked absolutely dominant in two of his three starts this season, going a combined 16 shutout innings with 17 strikeouts. Berrios will be looking to build off those two starts in what will be his biggest start of the season thus far. Berrios made just one start against the Indians last year, where he was lights out, surrendering just one run, over 7.2 innings. Cleveland Indians Much like the Twins, the Indians felt the effects of the snowstorm over the weekend, as each of the last two games in their series against Toronto were postponed. This is unfortunate news for the Twins, as Corey Kluber was originally scheduled to pitch on Saturday, but has been pushed back to start Tuesday night against the Twins. The Indians bats still haven’t gotten going yet this year, as they have a mere .200 batting average as a team, and currently have league worst 68 wRC+ through the first few weeks of the season. Probable Starting Pitchers RHP Corey Kluber Corey Kluber has established him self as one of baseball's premier pitchers. Over the last four seasons, Kluber has won two AL Cy Young awards and finished in the top-10 in Cy Young voting in the two years he didn’t win the award. Kluber’s curveball is regarded by many as perhaps the best pitch in baseball. Last year, Kluber allowed a staggeringly low .111 wOBA on his curveball and has been even better so far this season. Kluber was dominant in his lone start against the Twins in 2017, where he struck out 13 over seven innings, and allowed just two runs (both unearned). However, the Twins were fortunate enough to escape that matchup with a 4-2 victory. RHP Carlos Carrasco The 2017 Indians starting rotation was arguably the best starting rotation in MLB history, setting the all-time MLB record for fWAR by a starting rotation at 31.7 (2.2 higher than the next best rotation). A big par of that was having Carlos Carrasco as a second ACE in their rotation to complement Corey Kluber. Much like Kluber, Carrasco’s signature pitch is his curveball. Despite his slight dip in strikeouts to start 2018, Carrasco has still had a strong start to his season. Hopefully Carrasco waits at least another start before he returns to form as one of elite strikeout pitchers in the game. Players to Watch Francisco Lindor, SS Francisco Lindor developed himself into a true five-tool player after belting 33 home runs last season. Perhaps the strongest tool of Lindor’s game is his defense. Since he came into the league in 2015, the 24-year-old ranks third among shortstops with 32 Defensive Runs Saved. Lindor has gotten off to a slow start with a .241/.302/.379 slash line. Despite this he has still been the best hitter in the Cleveland lineup. Jose Ramirez, 3B The other half of perhaps the best left-side of the infield in baseball, Jose Ramirez has played a huge part in the Indians’ success over the past couple of seasons. Last year his 56 doubles were the most by any hitter since Todd Helton hit 59 in 2000. He showed his flexibility by playing 71 games at second last season, though he has moved back to his natural position at third with Jason Kipnis healthy again to begin 2018. Edwin Encarnacion, DH Edwin Encarnacion had a change of scenery last season (moving from Toronto to Cleveland) but he didn’t miss a beat hitting a team leading 38 home runs. Encarnacion’s power has been incredibly consistent over the last handful of years, as he has hit at least 34 home runs in every season since 2012. Bullpen Comparison *Represents Minor League Stats Trevor Hildenberger has gotten off to a very discouraging start to the season. Sure, he has a respectable 3.86 ERA, but that doesn’t come close to telling the whole story. One of the most important roles of a relief pitchers is being able to strand inherited runners, and Hildenberger has allowed all seven of his inherited runners to score thus far. Part of this has been his inability to strike out opposing hitters, as he has struck out just 2 of the 30 batters that he has faced. The Indians bullpen suffered a big loss this offseason when Brain Shaw signed with the Colorado Rockies. Nonetheless they still feature maybe the best one-two punch any bullpen has to offer with Andrew Miller and Cody Allen. However, outside of those two the Indians bullpen can be vulnerable. In a move to add some depth to their bullpen, the signed former Twin Matt Belisle. Zone Charts courtesy of baseballsavant.com
-
2,000 Words on Joe Mauer to Celebrate 2,000 Hits
Andrew Thares replied to Nick Nelson's topic in Twins Daily Front Page News
Count the title and you've got yourself 2000 -
"An interesting note, in a couple of the extra innings, the Red Wings manager had the pitcher intentionally walk the leadoff batter of the inning to set up a first and second situation. It worked the first two times." I am very interested in seeing how this plays out over the course of the season. If you are the home team, I think it is smart to follow the run expectancy rules and not walk the leadoff hitter (Teams score an average of roughly 1.10 runs with a runner on 2nd and 0 outs, vs the roughly 1.50 runs with a runners on 1st and 2nd and 0 outs). However, if you are the visiting team and you can't give up a single run or you lose, the best approach would be to use the best strategy to prevent giving up a single run. In terms of runner on 2nd and 0 outs vs 1st and 2nd and 0 outs, they are nearly identical at roughly a 61% chance of giving up a run.
- 25 replies
-
- 1
-
-
- lewin diaz
- tyler wells
- (and 3 more)
-
2,000 Words on Joe Mauer to Celebrate 2,000 Hits
Andrew Thares replied to Nick Nelson's topic in Twins Daily Front Page News
This was a great read! Thanks Nick! -
Logan Morrison: Bad or Just Bad Luck?
Andrew Thares replied to Andrew Thares's topic in Twins Daily Front Page News
Russell Carleton touched on the difficulty of bunting in a recent article he wrote about why Joey Gallo should start bunting. A lot of what he writes about in this article would apply to Logan Morrison as well. https://www.baseballprospectus.com/news/article/38922/baseball-therapy-bunt-joey-bunt/ -
Logan Morrison: Bad or Just Bad Luck?
Andrew Thares replied to Andrew Thares's topic in Twins Daily Front Page News
Its actually pretty simple. Each batted ball put in play is given a hit probability based on the launch angle and exit velocity. Then you take the average of the ones that are not home runs and that is the deserved BABIP. -
The start of Logan Morrison’s tenure with the Minnesota Twins has been, how can I put this delicately, worse than Byron Buxton’s start last season. Through his first 26 plate appearances, Morrison has a .043/.154/.087 slash line, and a -30 wRC+. This is not exactly what the Twins had in mind when they signed Morrison to be their full-time designated hitter. Image courtesy of Charles LeClaire-USA TODAY Sports The start of Logan Morrison’s tenure with the Minnesota Twins has been, how can I put this delicately, worse than Byron Buxton’s start last season. Through his first 26 plate appearances, Morrison has a .043/.154/.087 slash line, and a -30 wRC+. This is not exactly what the Twins had in mind when they signed Morrison to be their full-time designated hitter. Fortunately for the Twins, 26 plate appearances is a pretty small sample, and unless Morrison completely forgot how to play baseball, he will turn it around. Even before Morrison’s breakout season last year he had a career OPS+ of 104, so it’s not like 2017 was a one-hit-wonder. As is often the question with extreme performances over a small sample, has this performance been based on the player’s skill during that time, or has it been propped up/dragged down by luck? Fortunately, with the evolution of Statcast, along with other metrics, whe can make more reasoned assumptions about a player’s performance than we would have been able to in the past. So, let’s dive into the numbers and see if there is anything definitive that we conclude about Morrison’s performance. Plate Discipline If a hitter is in the middle of a slump, it is often due to having poor plate discipline during the slump. This makes it a great starting point to see if a hitter is playing poorly because of outside factors, or if he is simply taking a poor approach at the plate. Looking at Morrison’s strikeout and walk rates, neither sticks out as anything too far off from where he sits normally. Morrison currently has a 23.1% strikeout rate, which is right in between the 22.4% and 24.8% he averaged in 2016 and 2017 respectively. Additionally, his walk rate is at 7.7%, which isn’t too far off his 10.5% career average. While Morrison’s strikeout and walk numbers don’t look that bad, his swing rate tells a different story. So far this season, Morrison has an O-Swing rate of 35%, which is a full 8% higher than his career average. His overall swing rate is also up by 11.1% on his career average. To me this is a sign of a hitter who is pressing to make an instant impact on his new team. This is hurting Morrison as he is usually falling behind in the count, and not getting many good pitches to swing at. Morrison’s BABIP To start the season, Morrison has put 17 balls into play with just one of those balls falling for a hit, resulting in a .059 BABIP. While it might be easy to jump to conclusions that this low number is based mostly on luck, that does not appear to be the case. According to Statcast, Morrison’s deserved BABIP is just .179. This number is a little bit higher than his actual BABIP, and suggests Morrison has been a little bit unlucky, but the entire difference can’t simply be written off as luck. For starters, the Statcast numbers do not control for the batted balls that are hit into a shift, thus decreasing the chances that they will become a hit relatively speaking. Unfortunately for Morrison, the book seems to be out on where to play defensively against him. Just look at how the Astros lined up against him with nobody on base Monday night. https://twitter.com/darenw/status/983507250873417728 In all, Morrison’s low BABIP can partially be written off as bad luck, but it is mostly a result of Morrison making poor contact and paying the price for being an extreme pull hitter. wOBA vs xwOBA Comparing Logan Morrison’s wOBA and xwOBA (expected weighted on-base average) works in much the same way as comparing Morrison’s BABIP with his deserved BABIP, in that wOBA is a results-based statistic and xwOBA is a Statcast generated statistic. However, using wOBA gives us a better all-around picture of how Morrison has been hitting. Thus far Logan Morrison’s wOBA sits at just .131 (league average is usually around .330). This is the fourth lowest number by any hitter with at least 20 plate appearances so far this season. By comparison, Morrison’s xwOBA sits at .166, which is the third worst mark of any hitter with at least 20 at-bats this season. So it is safe to say that Morrison has been performing about exactly as poorly as his Statcast data says he should be. Conclusion After digging through the data, it is quite apparent that Morrison’s slow start is almost entirely a result of bad hitting by Logan. If Morrison wants to turn it around he will need to bring a more patient approach to the plate. Much like it was for Eddie Rosario last season, Logan Morrison’s O-Swing% might be the key stat to follow for him as the season goes on. View full article
-
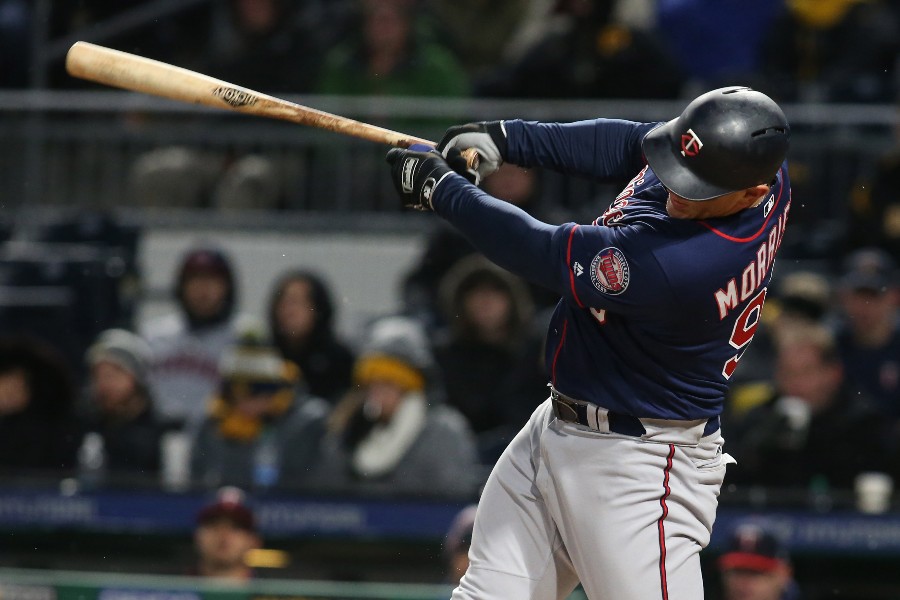 Fortunately for the Twins, 26 plate appearances is a pretty small sample, and unless Morrison completely forgot how to play baseball, he will turn it around. Even before Morrison’s breakout season last year he had a career OPS+ of 104, so it’s not like 2017 was a one-hit-wonder. As is often the question with extreme performances over a small sample, has this performance been based on the player’s skill during that time, or has it been propped up/dragged down by luck? Fortunately, with the evolution of Statcast, along with other metrics, whe can make more reasoned assumptions about a player’s performance than we would have been able to in the past. So, let’s dive into the numbers and see if there is anything definitive that we conclude about Morrison’s performance. Plate Discipline If a hitter is in the middle of a slump, it is often due to having poor plate discipline during the slump. This makes it a great starting point to see if a hitter is playing poorly because of outside factors, or if he is simply taking a poor approach at the plate. Looking at Morrison’s strikeout and walk rates, neither sticks out as anything too far off from where he sits normally. Morrison currently has a 23.1% strikeout rate, which is right in between the 22.4% and 24.8% he averaged in 2016 and 2017 respectively. Additionally, his walk rate is at 7.7%, which isn’t too far off his 10.5% career average. While Morrison’s strikeout and walk numbers don’t look that bad, his swing rate tells a different story. So far this season, Morrison has an O-Swing rate of 35%, which is a full 8% higher than his career average. His overall swing rate is also up by 11.1% on his career average. To me this is a sign of a hitter who is pressing to make an instant impact on his new team. This is hurting Morrison as he is usually falling behind in the count, and not getting many good pitches to swing at. Morrison’s BABIP To start the season, Morrison has put 17 balls into play with just one of those balls falling for a hit, resulting in a .059 BABIP. While it might be easy to jump to conclusions that this low number is based mostly on luck, that does not appear to be the case. According to Statcast, Morrison’s deserved BABIP is just .179. This number is a little bit higher than his actual BABIP, and suggests Morrison has been a little bit unlucky, but the entire difference can’t simply be written off as luck. For starters, the Statcast numbers do not control for the batted balls that are hit into a shift, thus decreasing the chances that they will become a hit relatively speaking. Unfortunately for Morrison, the book seems to be out on where to play defensively against him. Just look at how the Astros lined up against him with nobody on base Monday night. https://twitter.com/darenw/status/983507250873417728 In all, Morrison’s low BABIP can partially be written off as bad luck, but it is mostly a result of Morrison making poor contact and paying the price for being an extreme pull hitter. wOBA vs xwOBA Comparing Logan Morrison’s wOBA and xwOBA (expected weighted on-base average) works in much the same way as comparing Morrison’s BABIP with his deserved BABIP, in that wOBA is a results-based statistic and xwOBA is a Statcast generated statistic. However, using wOBA gives us a better all-around picture of how Morrison has been hitting. Thus far Logan Morrison’s wOBA sits at just .131 (league average is usually around .330). This is the fourth lowest number by any hitter with at least 20 plate appearances so far this season. By comparison, Morrison’s xwOBA sits at .166, which is the third worst mark of any hitter with at least 20 at-bats this season. So it is safe to say that Morrison has been performing about exactly as poorly as his Statcast data says he should be. Conclusion After digging through the data, it is quite apparent that Morrison’s slow start is almost entirely a result of bad hitting by Logan. If Morrison wants to turn it around he will need to bring a more patient approach to the plate. Much like it was for Eddie Rosario last season, Logan Morrison’s O-Swing% might be the key stat to follow for him as the season goes on.
-
Well if Spotrac has it wrong then I guess I do too
-
Per Spotrac: Contract Notes: 2019 Option includes a $1M buyout Option Vests with 200 IP in 2018 or 400 IP from 2017+2018 2015: Suspended 80 Games, forfeiting $5.9M
-
"Santana has some money on the line as well this season. If he pitched over 200 innings, his $14 million option would vest for 2019. He’s only pitched 200 innings once over the last four seasons and that was last year when he tossed 211.1 innings. He likely won’t make enough starts the rest of 2018 to reach the 200 inning mark." Not that it really matters at this point, but Santana only needed 188 and 2/3 IP this season for his vesting option to be picked up. His contract states either 200 IP in 2018, or 400 IP in 2017 and 2018 combined for the option.
- 57 replies
-
- 4
-
-
- ervin santana
- phil hughes
- (and 3 more)

