



alexlegge
-
Posts
130 -
Joined
-
Last visited
Content Type
Profiles
News
Minnesota Twins Videos
2026 Minnesota Twins Top Prospects Ranking
2022 Minnesota Twins Draft Picks
Minnesota Twins Free Agent & Trade Rumors, Notes, & Tidbits
Guides & Resources
2023 Minnesota Twins Draft Picks
The Minnesota Twins Players Project
2024 Minnesota Twins Draft Picks
2025 Minnesota Twins Draft Pick Tracker
2026 Minnesota Twins Draft Tracker: Picks & Bonuses
Forums
Blogs
Events
Store
Downloads
Gallery
Everything posted by alexlegge
-
Team Pitching Efficiency: Interesting Revelation
alexlegge replied to alexlegge's topic in Minnesota Twins Talk
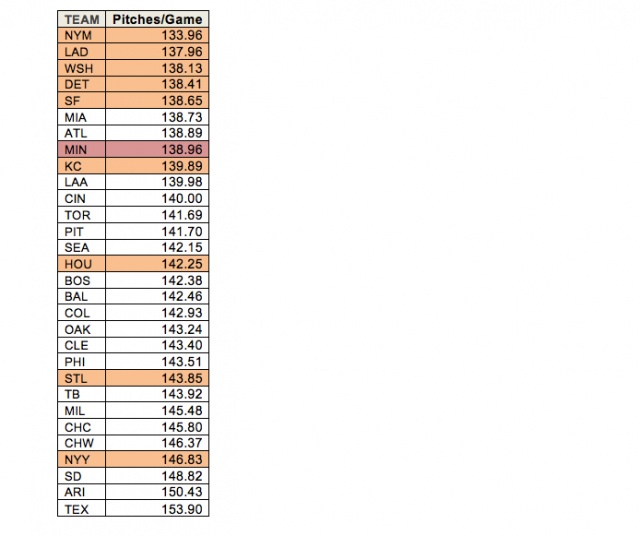
Cool - thanks for the link! If you go by pitches per game over the last 2 years, the Twins were 8th in 2014 (5 out of the top 6 teams made the playoffs) and 26th in 2013 (7 out of the top 9 teams made the playoffs). -
Take a look at this list of pitches thrown per game. Teams in playoff spots are highlighted. Obviously, this sort of statistic takes a lot of things into account, but it seems to be a good measure of overall team pitching efficiency. Maybe this is one metric where the Twins' old organizational philosophy of 'pitch to contact' is kind of a good thing. Of note: there are a small handful of pitchers whose stats I did not incorporate because they've pitched for more than one team already - including Nick Masset, who has pitched for both the Marlins and Braves this year. Accounting for his 195 pitches, both of those teams are probably worse than the Twins and Royals.
-
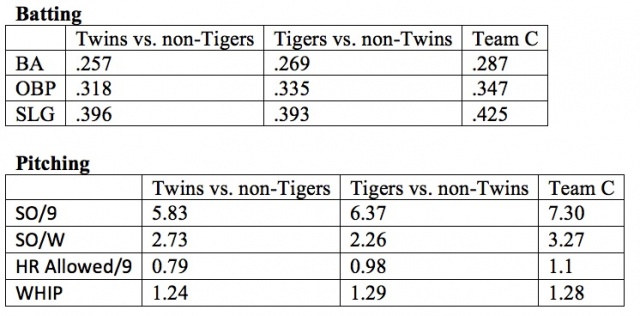
It’s fairly shocking to see the Twins and Tigers in a virtual tie for 2nd place, especially considering how poorly the Twins have played in Tigers-Twins games. To make some sense of this enigma, I decided to compare the two team using some simple metrics, excluding their head-to-head games: Minus their head-to-head games, the Twins and Tigers seem relatively evenly matched. The Tigers look like a slightly superior offensive club based on their ability to get on base. The Twins, on the other hand, look like a slightly superior pitching club based on their control and ability to keep the ball in the ballpark. Some of these slight differences are somewhat surprising, but they make more sense if you consider ballparks. Next, let’s compare the teams in terms of overall performance: Based on this, it is clear that the Twins have done a lot more than the Tigers with essentially the same performance. Essentially, their tie for second-place seems to be only because of the Twins’ over-performance and the Tigers’ under-performance. Finally, let’s compare these teams with Team C. Team C seems to be better than or equal to both the Twins and Tigers in virtually every measure except HR allowed. And Team C’s overall performance is excellent, though not quite as videogame-ish as the 2015 Twins minus Tigers games. Who is Team C? The 2006 Twins, who were arguably the best Twins team during the Gardenhire era, finishing 96-66 (3 games better than their Pythagorean record). So how can we explain the Twins’ crappy performance against the Tigers so far this season? Here are 4 possibilities: 1. Statistical regression toward the Twins’ actual playing ability has mostly occurred during games with the Tigers 2. The Twins don’t “match up” well with the Tigers 3. Small sample size 4. The Twins have a psychological block against the Tigers In reality, there’s probably a kernel of truth to all of these things. Possibilities 1 and 2 are fairly self-explanatory, although it’s also worth pointing out that the 2011-2014 Twins teams played substantially better against the Tigers than this 2015 team so far, which seems to support possibility 3. Possibility 4 may be the most intriguing. Perhaps the Twins, on the brink of becoming a contender, are intimidated by a Tigers team that has been the class of the division since 2011. In essence, these Twins may be so used to perceiving themselves as a second-tier team compared to the Tigers that their perceptions actually play out on the field in head-to-head games. This wouldn’t be the first time this has happened to a Twins team on the brink of contention; you may recall the 2001 Twins, who went 5-14 against the Indians and lost the division to them by 6 games. I wouldn’t be surprised if this year plays out similarly with respect to the Tigers and Twins. It’s also interesting to consider the Twins decent performance against the Royals, who are clearly a phenomenal team but don’t have the years of winning to enhance their ‘intimidation factor.’ In any case, I’m excited to see how the Twins’ performance against the Tigers – and everyone else – plays out over the rest of the season.

-
What If The Twins Drafted Mark Prior?
alexlegge replied to Kyle Eliason's topic in Twins Daily Front Page News
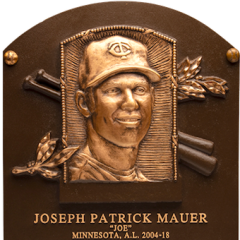
Thanks for a well-written and thought-provoking article. However, I can't say I agree. As mentioned by other commenters, Prior's entire development would have been different in the Twins system. In my opinion, the best-case scenario is that we would've ended up with a Radke clone. You could make a decent argument in favor of that over Mauer only if Prior stayed healthy as long as Radke, but it only applies to the regular season. Your argument is based on the postseason, which is a complete roll of the dice. Remember that in the 2002 ALCS, Santana was lit up out of the bullpen while the only memorable Twins start was Joe Mays in Game 1. Mauer has been our best position player on four additional division series teams after Prior’s injury bug, not to mention the 2008 tiebreaker team (would Prior have even topped Nick Blackburn’s sparkling performance in that?). Let’s review the 4 division series: - 2004: This is probably the only instance where you could make a solid argument that Prior would have helped us overcome the Yankees. We would’ve had a better shot at leaving NYC up 2-0. - 2006: Santana lost Game 1. Bonser pitched extremely well in Game 2, which we only lost because of Hunter’s misplay. Prior wouldn’t have fared much better under those circumstances. Also, Mauer was incredible this season in a 3-team division race. - 2009: The team was exhausted from the play-in game and played like crap the whole series. Maybe we would have won the division more easily with Prior, but not without Mauer. - 2010: Another great season for Mauer. And even in an ideal world, we wouldn’t have had Liriano’s Game 1 start (which was sub-par but gave us a reasonable chance to win). Bottom line: No question that 2002-2003 would have been different with Prior, but how different? Probably not much, and it’s impossible to speculate beyond that. Ultimately, Cubs fans could make a much much much stronger argument in favor Mauer propelling them to the World Series in 2007-2008. -
Maddon vs. Gardy: How much of an improvement would Maddon be?
alexlegge replied to alexlegge's topic in Minnesota Twins Talk
The 2010 sweep stuck with me because I still hold a grudge against the Yankees. The Yanks were still favorites because they had essentially backed out of the AL East title in hopes of facing the Twins instead of the Rangers (sacrificing homefield advantage in the process). I feel like those 2010 Yanks were a big part of instigating the second wild card - to prevent teams from backing out of a division title. That would make three straight years of the Twins getting shafted on rules that would later change (2009 playoffs was a prime example of the need for instant replay, and the Twins should've had homefield advantage in the 2008 tiebreaker were it not for the stupid coin flip rule). And then of course there was the Vikings losing in overtime after one possession in the 2010 NFC Championship, ugh... -
Maddon vs. Gardy: How much of an improvement would Maddon be?
alexlegge replied to alexlegge's topic in Minnesota Twins Talk
This was something I struggled with, and probably could be solved with more advanced metrics. There are several components of in-game managerial moves that aren't captured in Pythag projections. Defensive shifting is a big one, which Maddon is of course well known for. That wouldn't be captured (at least not much) in a manager's ability to win close games. Ultimately, I wonder if it's feasible to put together a measure of all managerial decisions that are directly game-related - namely lineups, defensive shifts, replays, substitutions, and steals/bunts/pitchouts/etc.... Team performance after ejections could be also be interesting. Obviously, total runs scored would be related to how the game is managed on all these levels - but I'd argue that it lurks much farther into player performance and front office influence, instead of isolating managerial moves. In any case, thanks for your comments! Very much appreciated- 44 replies
-
- 1
-

-
- joe maddon
- ron gardenhire
- (and 3 more)
-
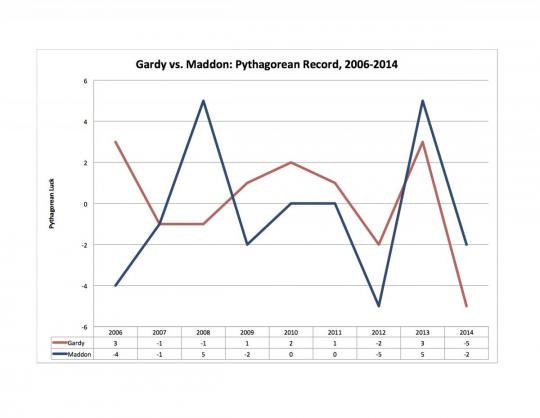
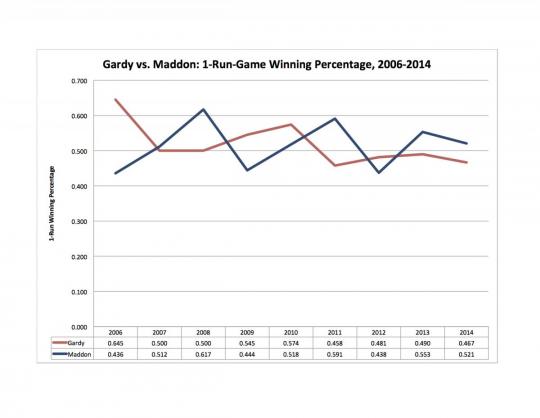
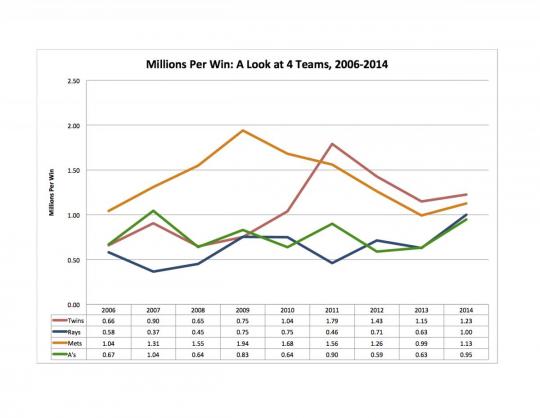
Maddon vs. Gardy: Comparing Performance of Two Managers With the news of Joe Maddon’s opt-out, Twins fans everywhere are clamoring for the front office to make him a serious offer. Maddon has earned a reputation as one of the greatest minds in the game, a savvy and sabermetrically-aware manager capable of getting a lot of production out of his players. Just how much of an improvement would Maddon be over Gardy? It is widely thought that he will command a salary near Mike Scioscia’s $5 million. This would be a big step up from the $2 million Gardy will be earning for the last year of his contract, but certainly not a bank-breaker by MLB standards. Since 2006, both Gardy and Maddon have been at the helm of several playoff teams with little postseason success. Factor in Gardy’s 2002-2005 seasons, and you generally have more of the same. Both managers have also received praise from baseball writers. Maddon was named American League Manager of the Year in both 2011 and 2008. Gardy won the award in 2010 and finished runner-up in 2006, 2008, and 2009. Both men are generally seen as “player’s managers” who run loose and comfortable clubhouses. A major difference between Gardy and Maddon is their usage of sabermetrics and advanced stats. Gardy has publicly mocked them, while Maddon has embraced them. For instance, Maddon revolutionized defensive shifting. Gardy, meanwhile, has been consistently hesitant to platoon players, demonstrating a non-acknowledgement of numbers. Unfortunately, it is difficult to quantify managerial performance. From a fan’s perspective, we can only judge based on what we see on the field and in the papers. Here, I’ve attempted to quantify (albeit crudely) the managerial performance of Gardy and Maddon. I’ve used a few simple metrics to clump managerial performance into two broad categories: 1. Making the most out of every run, as evidenced by team performance in 1-run games and relative to Pythagorean record. This is largely related to in-game managerial decisions and luck. Team confidence also factors into this; a team that is confident in their ability to win should, in theory, win more close games. Presumably, a manager can affect this. 2. Making the most out of cheap players, as evidenced by money spent per win. This reflects several things – lineup decisions, clubhouse rapport, defensive positioning, and front-office performance. The extent to which a manager affects this is unknown and undoubtedly varies from team to team. Making the Most Out of Every Run Here are comparisons of Gardy (red) vs. Maddon (blue) in Pythagorean difference (Pythagorean wins – Actual wins) and 1-run games from 2006-2014: Over the course of 2006-2014, Gardy has a Pythagorean record of +1 overall, while Maddon’s is -4. In that span, their 1-run records are virtually identical: Gardy is 221-211 (.512), while Maddon is 215-202 (.516). What do these numbers mean? Basically, they say two things. First of all, both managers have fielded teams that are, on average, slightly better in close games than their opponents. In that sense, both Gardy and Maddon seem to be above-average managers. However, neither manager is capable of making extraordinary in-game decisions that lead to far more wins than expected based on runs. If Maddon is substantially better than Gardy, it doesn’t show up in these metrics. Making the Most Out of Cheap Players While neither Gardy nor Maddon has had the opportunity to work with gargantuan payrolls, there is a clear difference here: from 2006-2014, the Twins won 709 games for a total payroll of $723.05 million ($1.02 million per win), while the Rays won 754 games for $479.65 million ($0.64 million per win). This is a striking difference. Furthermore, it is completely in-line with Maddon’s reputation as someone who can do a lot with a low payroll. But a huge question remains – just how much does a manager actually affect wins per dollars spent? Does a great manager make a difference? Or is this more closely linked to front office decisions? In an effort to examine this, I compared 2006-2014 year-by-year money spent per win of four teams: 1. Twins (red) 2. Rays (blue) 3. Mets (orange; a team with changing managers and a front office with a poor reputation) 4. A’s (green; a team with changing managers and a front office with a great reputation) Here are the results: What’s interesting here is that the A’s have been almost as efficient with their money per win as the Rays, despite a revolving door of managers. And this doesn’t even include Billy Beane’s first 8 years as the A’s GM, when he originally championed the “Moneyball” philosophy. The Twins were part of the “efficient” group until 2010-2011. Two things happened around this time: 1) Joe Mauer started earning a lot more money, and 2) Bill Smith’s craptastic decisions reached a peak, trading Wilson Ramos for the overpriced Matt Capps and trading the underpriced J.J. Hardy for nobody noteworthy. Since then, the Twins have been struggling to spend money efficiently, especially with Mauer’s clunker contract still looming large. The Mets have been relatively inefficient spenders from 2006-2014, although they have heading in the right direction more recently. Like the Twins, they fired a GM during this time - Omar Minaya in 2010. How much is Gardy to blame for the Twins inefficiency over the last four years, and how much should Maddon be credited with the Rays efficiency? These figures suggest that front office changes are far more meaningful in this regard – the consistently clever A’s and Rays front offices have kept their teams efficient despite drastically different managerial histories. Meanwhile, the Twins and Mets efficiency has fluctuated more with front office changes than managerial changes. Take-Home Points Overall, Maddon hasn’t really outperformed Gardy in any in-game metrics that could confer an advantage per run scored. And although Maddon probably had some impact on the Rays’ efficiency per dollar spent, front offices appear to be far more influential than managers. Bottom line: it would be wicked cool to welcome Joe Maddon as the Twins’ next manger, and he’d certainly sell more tickets. But in comparison to the front office, his impact would be relatively small.
- 44 replies
-
- 7
-
-
- joe maddon
- ron gardenhire
- (and 3 more)


